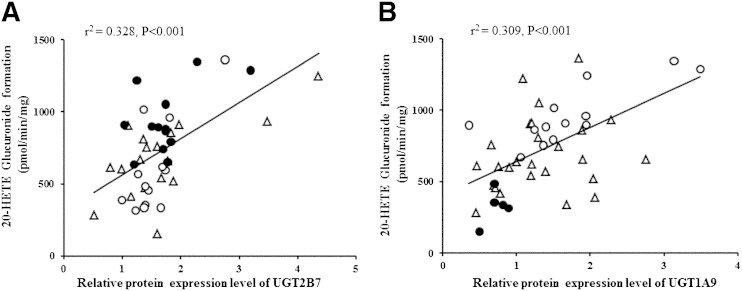
Fig. 5.
Correlation between 20-HETE glucuronidation and UGT protein amount with genotypes among HLMs (n = 44). A: Correlation between 20-HETE glucuronidation and UGT2B7 genotypes with its protein level. Solid circles, UGT2B7 802C/C; open triangles, UGT2B7 802C/T; open circles, UGT2B7 802T/T. B: Correlation between 20-HETE glucuronidation and UGT1A9 genotypes with its protein level. Solid circles, UGT1A9 −118T9/T9; open triangles, UGT1A9 −118T9/T10; open circles, UGT1A9 −118T10/T10. The formation of 20-HETE glucuronide was analyzed by HPLC coupled with MS. The protein expression was analyzed by Western blot. Genotyping of UGT2B7 802C>T and UGT1A9 −118T9>T10 variants was determined by direct DNA sequencing. Further details are described in the Experimental Procedures.

