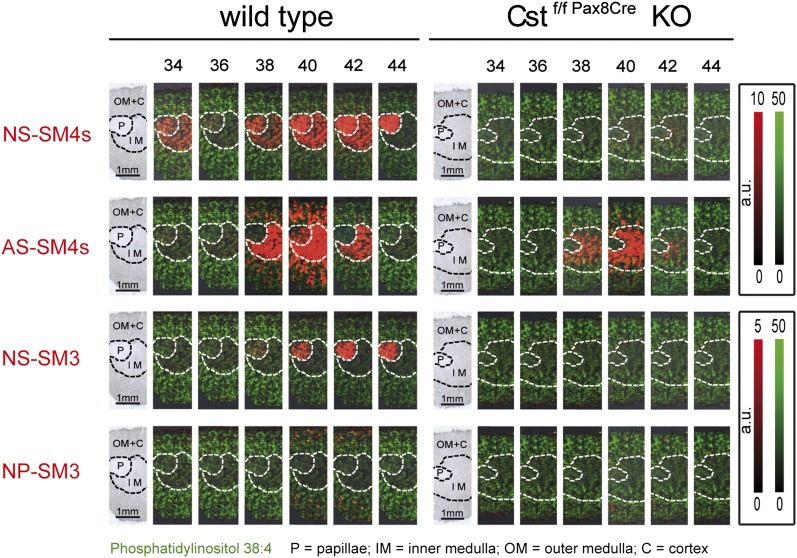
Fig. 2.
MALDI IMS of renal sulfatides in wt (left) and sulfatide-deprived (right) mice. Kidneys were dissected vertically to the longitudinal axis so that sections contained papillae, medulla, and cortex. The first picture of each series represents light microscopy of the analyzed renal section. Areas attributed to papillae (P), inner medulla (IM), and outer medulla together with cortex (OM+C) are marked with dotted lines. Individual sulfatide species are plotted with the false color red and are sorted by head group and type of ceramide anchor, as well as by length of the acyl chain. MS signal intensities relate to color intensity, which was normalized for all sulfatides of the identical head group (either SM4s or SM3) to the same color intensity per absolute signal counts; see color code on the right. Likewise, the signal intensities for PI (38:4), represented with the false color green, were normalized to the same intensities in wt and mutant sections. Note the loss or strong reduction of signals attributed to sulfatides in mutant (right) as compared with wt kidney.

