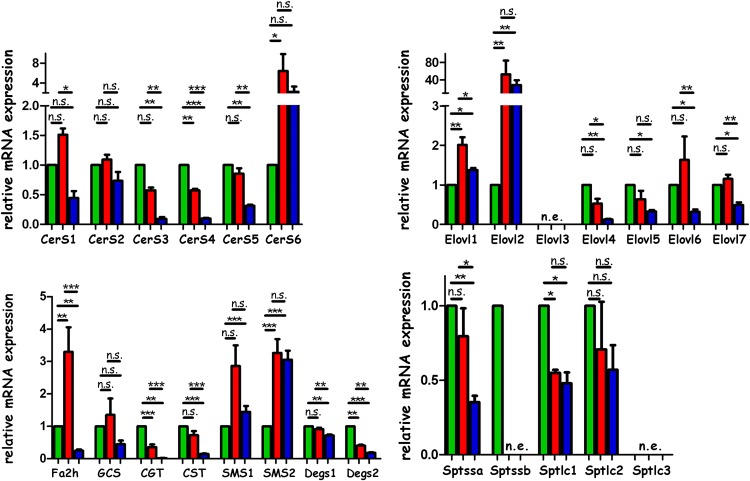
Fig. 10.
Quantitative real-time PCR-based analyses of mRNA expression of enzymes involved in the anabolic pathway of sulfatides in renal papillae (green), medulla (red), and cortex (blue). Expression values were calculated by the 2−ΔΔCt method and are represented relative to papillary expression. Significance was calculated using one-way ANOVA followed by post hoc Tukey’s test. Error bars represent mean ± SEM (n = 3).

