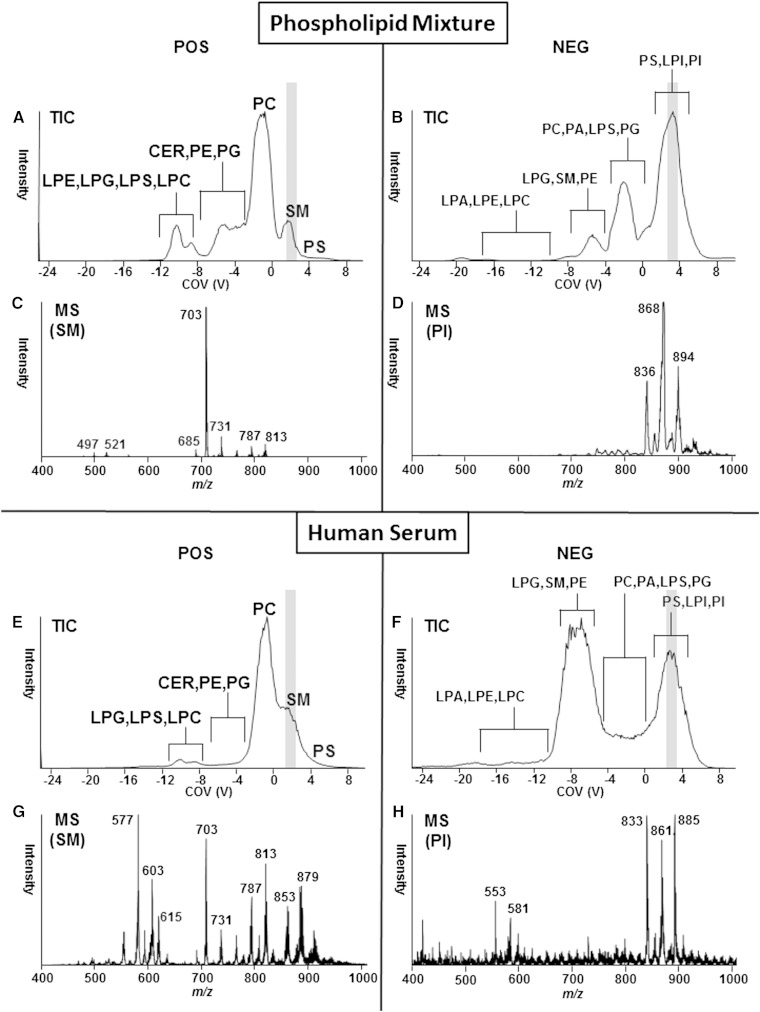
Fig. 2.
Separation of phospholipid and sphingolipid classes by DMS. DMS of purified phospholipids/sphingolipids in positive mode and negative mode. Top panels (A, B) show total ion current of DMS separation and MS detection using EMS and the trap function. COV voltage was ramped from −25 to 10. Bottom panels show summed mass spectral data from COV 1.7 to 2.3 specific for SM (C) or COV 2.4 to 3.8 specific for PI (D) indicated in gray above. DMS of human serum in positive mode or negative mode. Top panels (E, F) show total ion current of DMS separation and MS detection using the trap function. COV was ramped from −25 to 10. Bottom panels show summed mass spectral data from COV 1.7 to 2.3 specific for SM (G) or COV 2.4 to 3.8 specific for PI (H) indicated in gray above.

