Figure 2.
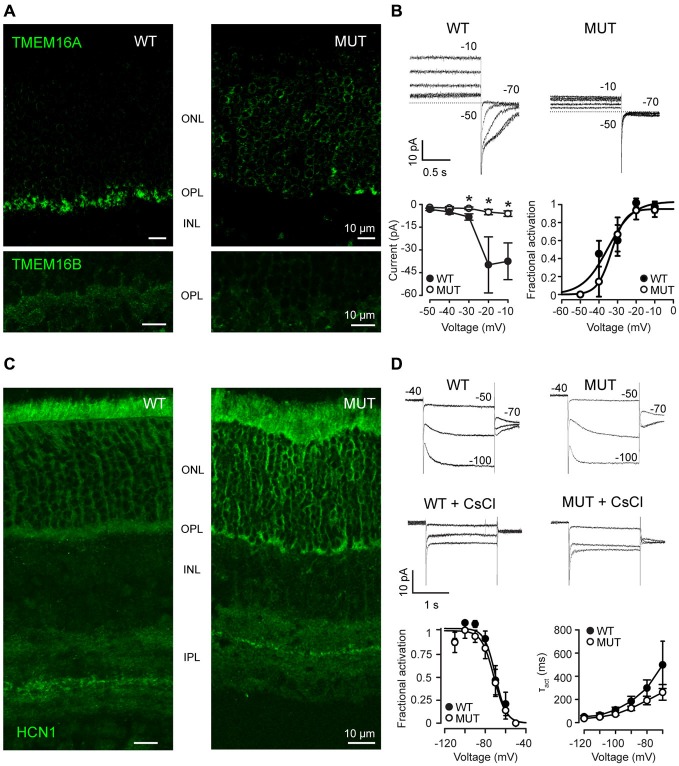
(A) Immunostaining of WT and mutant Cacna2d4 (MUT) retinas for TMEM16A (upper panel) and TMEM16B (bottom panel) channels. (B) Perforated-patch clamp recordings show steady-state currents evoked in representative photoreceptors of Cacna2d4 WT and mutant mice by voltages ranging from −50 to −10 mV, and the tail currents measured upon stepping to −70 mV. Numbers close to current traces report the applied voltages. Dashed lines plot the 0-current level. Note that at early times after establishing perforated-patch recordings, ICl(Ca) currents in response to voltage steps positive to −30 mV are outward. The currents, however, will turn inward at later recording times (not shown), as ECl shifts from about −50 to near 0 mV, due to the permeability of amphotericin pores to chloride and the use of 140 mM KCl in the pseudo-intracellular solution. The slow shift in ECl is consistent with the time required for the diffusion of chloride ions from the cell body compartment to the synaptic terminal. Circles in the left lower panel plot average tail current amplitudes (±SEM) at −70 mV (see “Materials and Methods” section). Circles in the right lower panel plot average values of the normalized fractional activation of gCl(Ca) (the conductance carrying ICl(Ca)), generated by averaging data from individual fits in 8 WT and 5 MUT rods. Curves plot best fits to average data by Equation 2 (see “Materials and Methods” section). Fractional activation was estimated in 5 out of 6 MUT rods, because gCl(Ca) in the remaining rod was too small for curve fitting. Average values (±SEM) of the maximal conductance resulting from individual fits were 1.02 ± 0.45 pS (WT, N = 8) and 0.14 ± 0.06 (MUT, N = 5). The difference between WT and MUT rods was statistically significant (*p < 0.05 by Mann-Whitney U-test). Average S values from individual fits were smaller than those generated by fits to average data due to the spread in V0.5 values between individual rods. (C) Immunostaining for Hcn1 channels in Cacna2d4 WT and mutant retinas. (D) Patch clamp recording of Ih in Cacna2d4 WT and mutant photoreceptors. Application of 3 mM CsCl to the perfusion bath confirmed the presence of Ih currents. Numbers close to current traces indicate the applied voltages. Circles in the lower leftmost panel plot average values (±SEM) of the fractional activation of the conductance (gh) carrying Ih, computed from individual fits in 8 WT and 6 MUT rods. Curves are best fits to data of Equation 2 (see “Materials and Methods” section). Circles in the lower rightmost panel plot the average time constants (τact) of Ih activation in the range −70/−120 mV. Time constant were estimated using Clampfit 8.0 to best fit currents with a single exponential function of the form: I(t) = Ae−t/τact where A is the amplitude of the activated current and τact is the time constant of activation.

