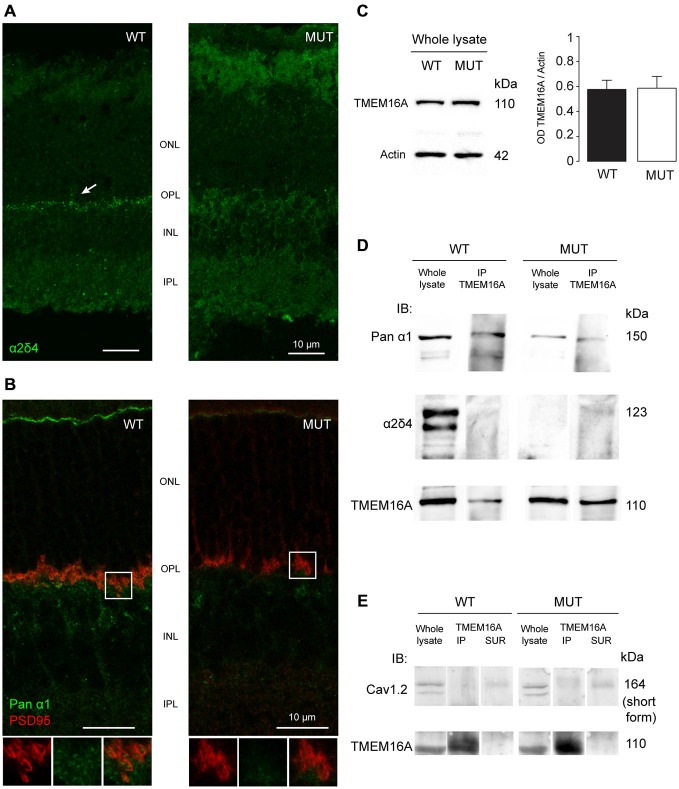
Figure 3.
(A) Staining of α2δ4 subunit in WT and mutant (MUT) animals. The arrow in the WT images shows the punctate labeling for α2δ4 subunit in the outer plexiform layer (OPL). Puncta are absent in mutant retina. (B) Co-localization of the α1 subunit of calcium channels (Pan-α1, green) and photoreceptor ribbon (PSD95, red) in WT retina. In mutant retina the structure of presynaptic terminal is disorganized as shown by the lack of horseshoe-shaped PSD95 staining. Bottom images show magnification of the boxed area. (C) Western blot analysis of TMEM16A content in retinas of WT and MUT animals. Left images: Example western blots. Right histograms: Optical density ratio TMEM16A/β-actin in WT and MUT mice. Values expressed as average ± SEM, n = 8 mice per condition, p = 0.94, t-test. (D) Immunoblot in retinal tissue from WT and MUT mice with antibodies against the α1 subunit (top row) and the α2δ4 subunit (middle row) of calcium channels, either in whole lysate (left) or after co-immunoprecipitation of TMEM16A (right). The bottom row shows the control labeling against TMEM16A (input). Representative example of N = 3 independent Co-IP experiments. Each experiment is the measure obtained from retinas of n = 4 animals. (E) Immunoblot in retinal tissue from WT and MUT mice with the antibody against Cav1.2 subunit of calcium channel (top row) either in whole lysate (left lanes), after co-immunoprecipitation of TMEM16A (middle lanes) or in control supernatant from co-immunoprecipitation (right lanes). The control labeling against TMEM16A (input) is shown in the bottom panels. Representative example of N = 3 independent Co-IP experiments. Each experiment is the measure obtained from retinas of n = 4 animals.

