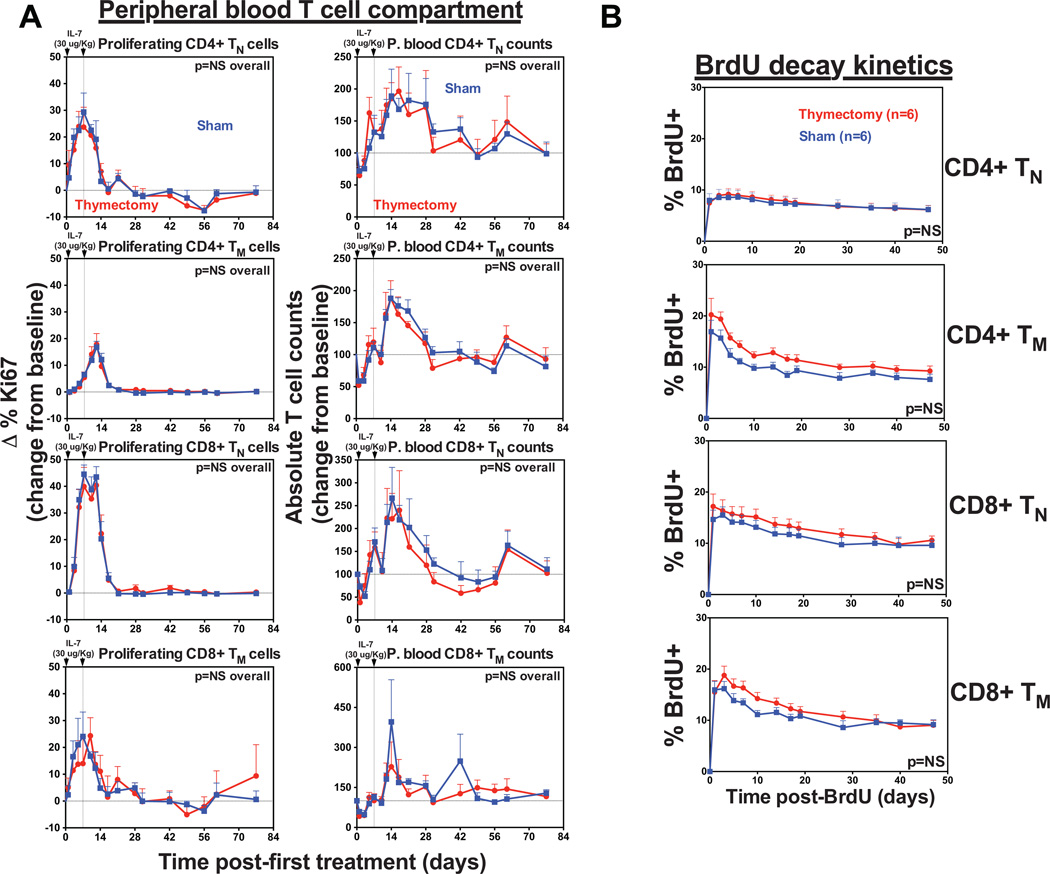
Figure 9. IL-7-induced T cell expansion is independent of a thymus.
(a) Comparison of CD4+ and CD8+ TN and TM dynamics (absolute counts and proliferative fraction) in the blood of juvenile thymectomized (n=6) vs. sham (n=6)-treated RM after s.c. injections (30µg/kg) of rsIL-7 on days 0 and 7. Results (mean + SEM) are shown as percentage of Ki-67+, change (Δ) from baseline or absolute counts percentage of baseline. Significance of differences in these parameters between groups was assessed as described in the materials and methods (NS, non-significant) (b) Both groups of thymectomized and sham-treated RM were administered four daily i.v. doses (30 mg/kg) of BrdU beginning day 10 after the first rsIL-7 injection, and samples were obtained before BrdU administration (day 0) and at subsequent intervals for flow cytometric analysis of BrdU incorporation in CD4+ and CD8+ TN and TM. The first post-BrdU sampling was 24 h after the last BrdU dose and is designated day 1. The percentage of total BrdU+ cells was determined at each time point. Results (mean + SEM) are shown as percentage of BrdU+ change (Δ) from baseline. The significance of differences in BrdU decay kinetics between thymectomized and sham-treated RM was statistically analyzed as described in the materials and methods (NS, non-significant).

