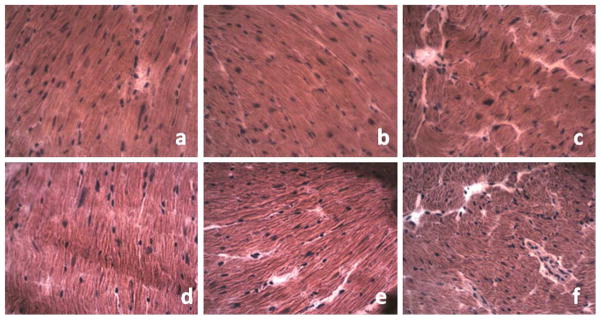
Fig. 5.

Histological assessment of differently oriented cardiac tissue sections of mice fed high ((a)–(c)) or low ((d)–(f)) GI diets. Representative images of H&E staining (all magnifications: 40×, each image is 225 × 180 μm2). Typical views (a:d = longitudinal, b:e = oblique, c:f = transverse cross sections) of cardiac tissues from C57BL/6 mice fed high GI (top) and low GI (bottom) diets, showing layered sheets of cardiac muscle cells (spindle-shaped and pink with blued stained multiple nucleoli within the center of each myocyte), separated by “interstitial tissue voids” (clear) between cardiac muscle cell fibers. Nuclear material was stained with hematoxylin (deep blue-purple color) and cytoplasmic material including connective tissue and collagen was stained with eosin (a bright pink color). (The colors are visible in the online version of the article; http://dx.doi.org/10.3233/BSI-130057.)
