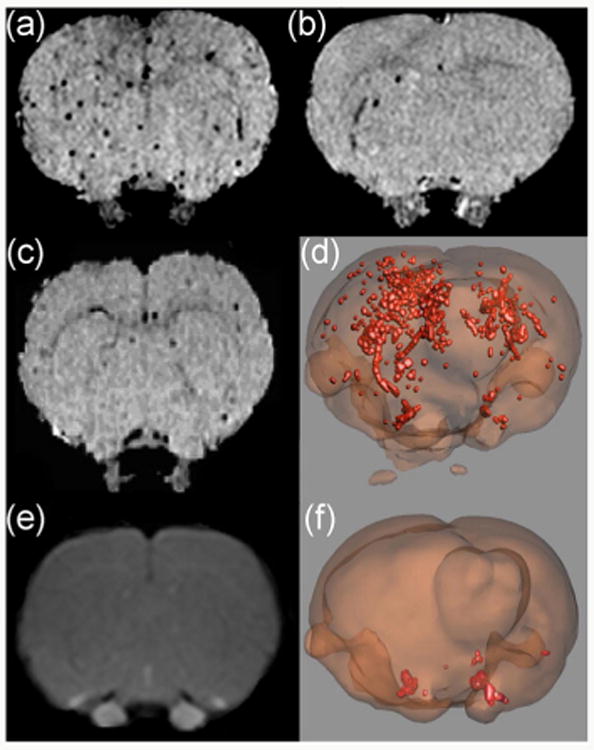
Figure 9.

In vivo MRI and 3D images of sLex-MNPs in the brain. (a) and (b) MRI images after intracerebral injection of 100 and 10 ng interleukin-1β followed by sLex-MNPs. (c) MRI image after injection of 100 ng interleukin-1β followed by MNPs. (d) 3D image of (b). (e) MRI image showing a lack of blood-brain barrier breakdown after 5.5 h incubation. (f) 3D image after sterile saline injection followed by sLex-MNPs, showing low binding. (Copyright Proceedings of the National Academy of Science. Reproduced from Ref. [146] with permission.)
