
Figure 4. Flow cytometric quantitative analysis of 8-OdG in AD fibroblasts grown in culture.
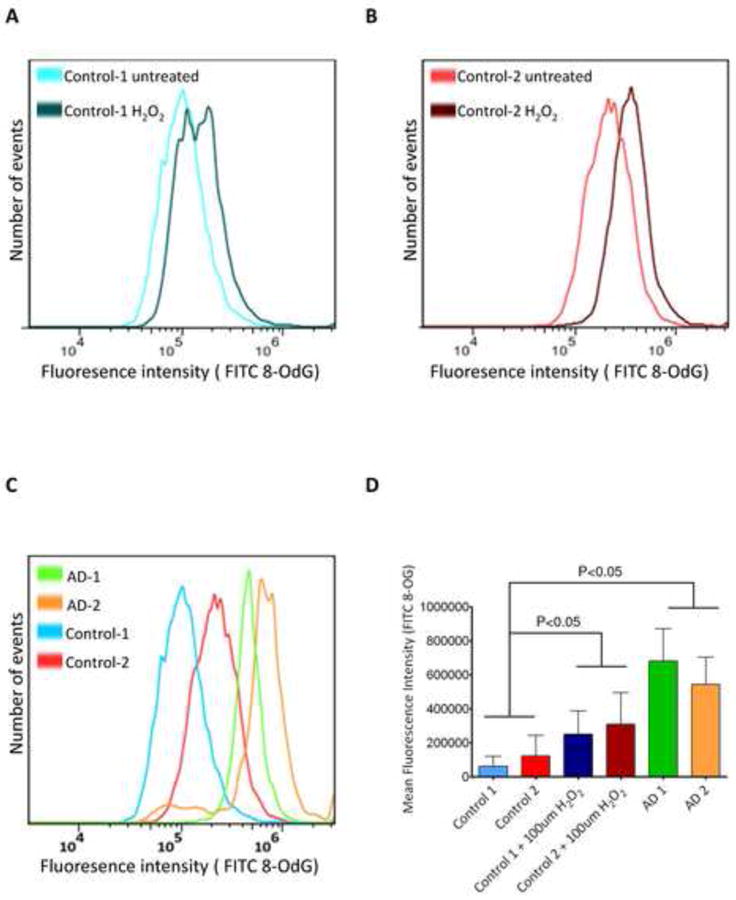
(A) Quantified FITC intensity as indicator of 8-OdG in fixed normal fibroblasts (control 1) after exposure to 100 μM H2O2 for 15 min. (B) As in (A), except using untreated normal fibroblasts (control 1). (C) As in (A), except using untreated normal fibroblasts (control 1), untreated normal fibroblasts (control 2), untreated AD fibroblasts (AG07374) and untreated AD fibroblasts (AG05770). (D) Quantification of the data shown in (C) using the mean value across different cell lines. Error bars show ±SEM, n=2 per cell line.