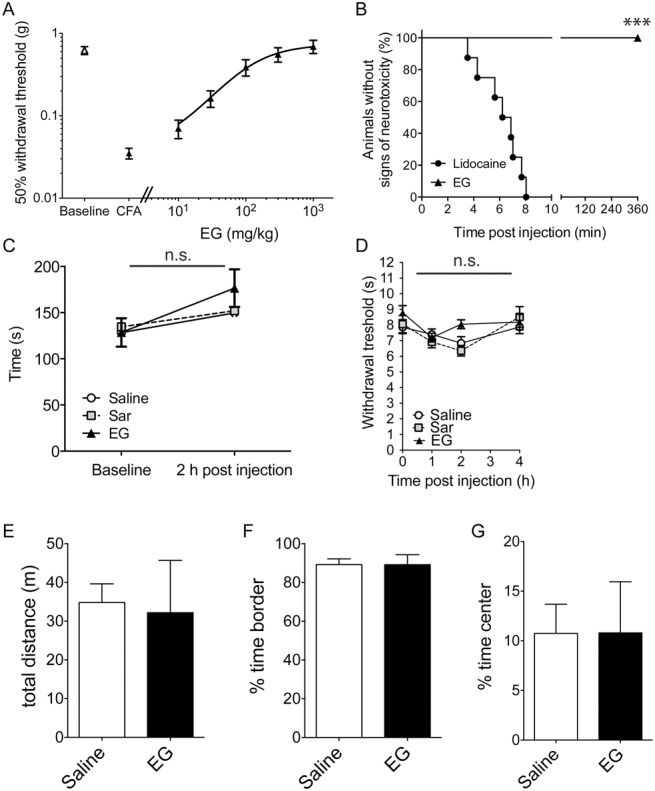
Figure 5.

Dose–response relationship of N-ethylglycine (EG) for treatment of inflammatory pain and screening for secondary and acute analgesic effects. (A), Dose–response for the effect of EG on thermal hyperalgesia (withdrawal thresholds using the Hargreaves method) 3 days after the induction of inflammatory pain by complete Freund's adjuvant (5 μL) injection. Data are expressed as mean ± SEM; n = 8 per group. (B), High-dose treatment with EG does not induce adverse neurological side effects; time until occurrence of signs of adverse effects was recorded in adult naive mice after subcutaneous injection of lidocaine (40 mg/kg) or EG (400 mg/kg). Data are expressed as the fraction (in %) of symptom-free animals (no irregular movements or signs of distress); n = 8 per group; ***P < 0.001 between groups; Mantel–Cox log-rank test. (C), EG (200 mg/kg), the known GlyT1 substrate sarcosine (Sar, 200 mg/kg), or saline was applied subcutaneously in adult mice after allodynia had developed 3 days after induction. Motor coordination was tested using the rotarod performance test before and 2 hours after treatment with EG. Riding times (in seconds) were measured. Data are expressed as mean ± SEM; n = 8 per group; no significant differences were detected between treatment groups; 1-way repeated-measures analysis of variance and Bonferroni post hoc test. (D), Behavioral data in naive adult mice in the left hind paw expressed as paw withdrawal threshold (in seconds) after subcutaneous application of EG (200 mg/kg), sarcosine (200 mg/kg), or saline. Assessment of analgesic effects was performed using the Hargreaves method at indicated time points. Data are expressed as mean ± SEM; n = 8 per group; no significant differences vs control group (saline) were detected; 2-way repeated-measures analysis of variance and Bonferroni post hoc test. (E-G), Open-field experiments were performed 2 hours after receiving a single dose of EG (200 mg/kg, subcutaneously). Total distance (E) and the time spent in the periphery (F) or the central quadrant (G) were determined. Data are expressed as mean ± SEM, n = 6 to 7 per group; no significant differences vs control group (saline) were detected (Student t test, P > 0.6).
