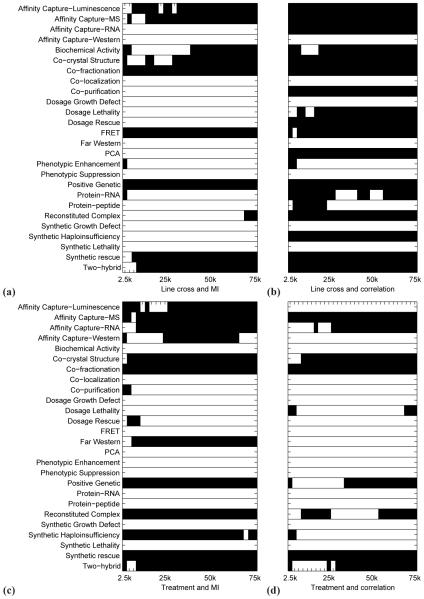
Fig. 2.
Heat maps showing where the enrichment of a network of a given size (i.e., at a given edge cut-off; x-axis) in known interactions of a given type (y-axis) is statistically significant (denoted by black color) according to the hypergeometric test (see Methods). The cut-off for statistical significance was computed at a False Discovery Rate (FDR) of 0.05. Panel (a) shows enrichment results for networks constructed from the line cross data using mutual information. Panel (b) shows enrichment results for networks constructed from the line cross data using correlation. Panel (c) shows enrichment results for networks constructed from the treatment data using mutual information. Panel (d) shows enrichment results for networks constructed from the treatment data using correlation. For example, “Affinity Capture-RNA” interaction type is not significantly enriched at any edge cut-off in panel (a), it is enriched at all cut-offs in panel (b), and it is enriched at most cut-offs (particularly larger ones) in panels (c) and (d).

