
Fig. 3.
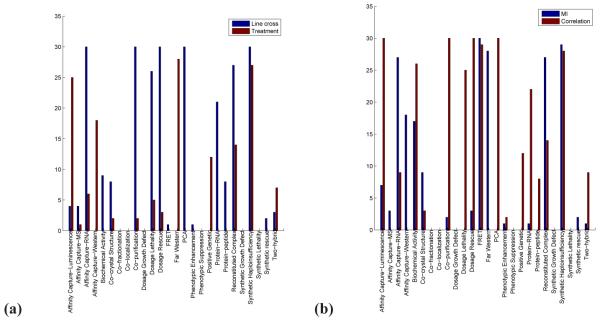
The absolute differences between networks constructed using different edge weighting methods (a) or data types (b) at different edge cut-offs (x-axis) with respect to the number of known interaction types that the networks are statistically significantly enriched in (y-axis). That is, based on Figure 2, for a given data type (line cross or treatment), for a given cut-off, we count for how many of the 26 known interaction types the significance of the enrichment of the network constructed using mutual information is different than the significance of the enrichment of the network constructed using correlation (panel (a)). By “different”, we mean that the enrichment with respect to one edge weighting method is significant (denoted by black color in Figure 2), while it is not significant with respect to the other edge weighting method (denoted by white color in Figure 2). Analogously, for a given edge weighting method (mutual information or correlation) and a given cut-off, we count for how many of the 26 known interaction types the significance of the enrichment of the network constructed from the line cross data is different than the significance of the enrichment of the network constructed from the treatment data (panel (b)). Now, by “different”, we mean that the enrichment with respect to one data type is significant (denoted by black color in Figure 2) while it is not significant with respect to the other data type (denoted by white color in Figure 2).