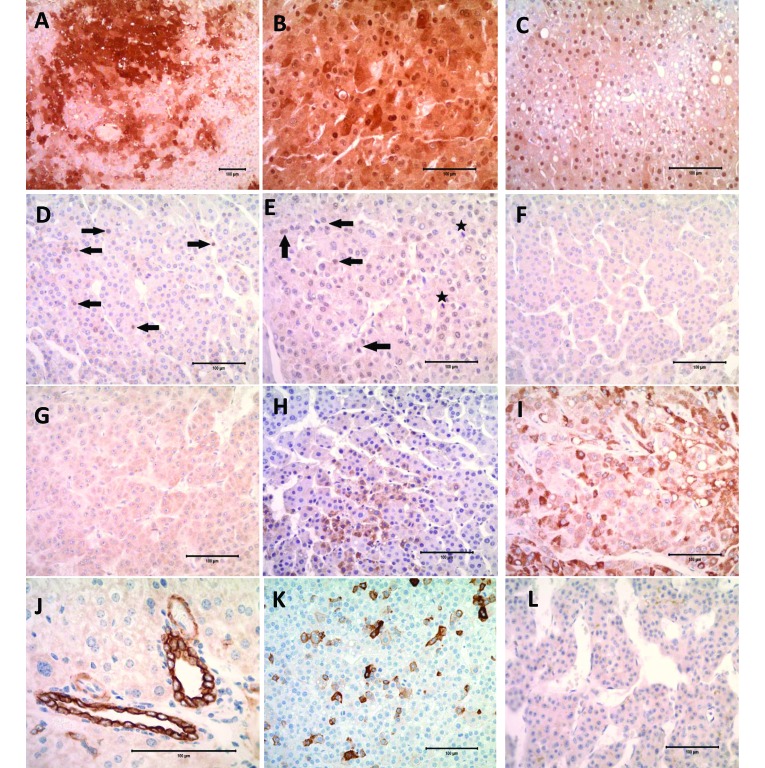
Figure 3.
(A) Mouse Solid HCC showing Arg1-positive cytoplasmic and nuclear staining; magnification, 10×. (B) Human HCC showing Arg1-positive cytoplasmic and nuclear staining; magnification, 20×. (C) Mouse vacuolated foci showing some Arg1-positive nuclear staining of vacuolated hepatocytes; magnification, 20×. (D) Mouse trabecular HCC showing nuclear staining of tumor cells with β-catenin (arrow); magnification, 20×. (E) Human HCC showing nuclear staining of tumor cells with β-catenin (arrow) and β-catenin-positive mitotic figures (star); magnification, 20×. (F) Glyp3-positive mouse Trabecular HCC showing light membranous staining; magnification, 20×. (G) Glyp3-positive human HCC showing light cytoplasmic and membranous staining; magnification, 20×. (H) Mouse trabecular HCC showing cytoplasmic staining for HepPar1; magnification, 20×. (I) Human HCC showing cytoplasmic staining for HepPar1; magnification, 20×. (J) Normal mouse liver showing typical intense staining of cholangiolar cells with CK19; magnification, 40×. (K) Mouse trabecular HCC showing intense cytoplasmic staining of scattered tumor cells with CK19; magnification, 20×. (L) CK19-negative human HCC; magnification, 20×.

