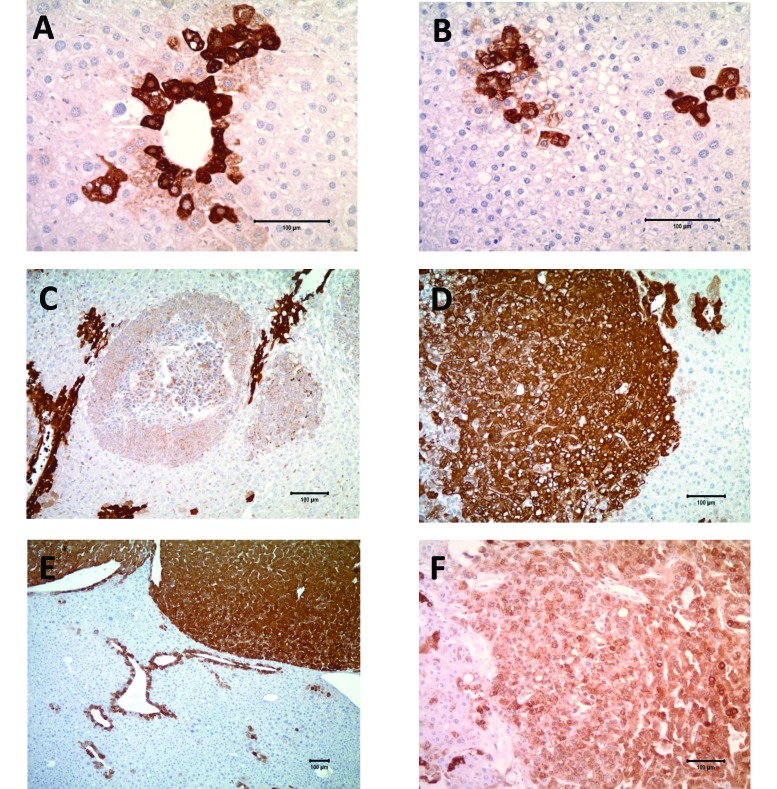
Figure 4.
Glutamine synthetase (GS) immunohistochemistry, with most sections showing cytoplasmic and membranous staining of varying intensity. (A) Normal liver (mouse): intense GS staining of zone 3 hepatocytes; magnification, 20×. (B) Clear-cell focus (mouse) showing intense GS staining of zone 3 hepatocytes that are incorporated into the focus; magnification, 20×. (C) Adenoid HCC (mouse) showing intense GS staining of zone 3 hepatocytes, with lighter-staining tumor cells; magnification, 10×. (D) Solid HCC (mouse) with positive GS staining of tumor cells; magnification, 10×. (E) Trabecular HCC (mouse) with intense GS staining of tumor cells that are well-outlined and -circumscribed. Normal perivenular staining is present as well; magnification, 5×. (F) Human HCC showing moderate cytoplasmic and membranous GS staining of neoplastic cells; magnification, 10×.

