Fig. 6.

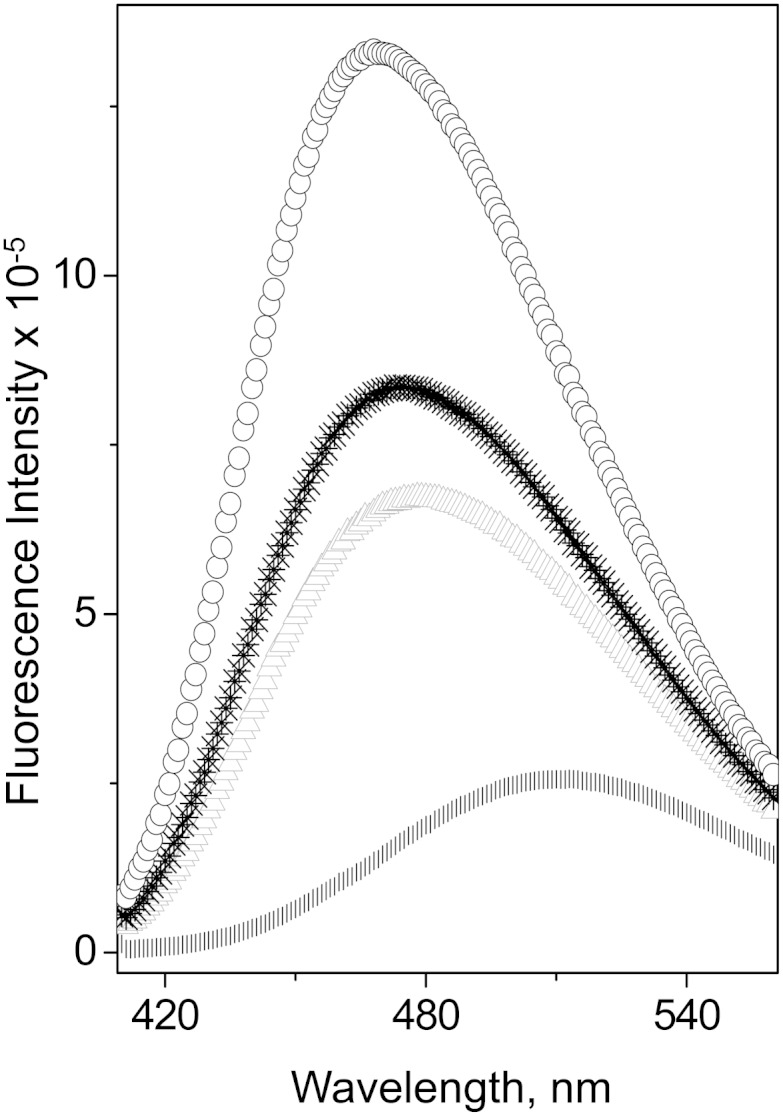
Fluorescence spectra of ANS in the presence of lipid-free apoA-I variants. Final sample concentrations are 250 μM ANS and 50 μg/ml protein. *, WT apoA-I; Δ, apoA-I[K107A]; ○, apoA-I[K107del]; |, in buffer alone.

Fluorescence spectra of ANS in the presence of lipid-free apoA-I variants. Final sample concentrations are 250 μM ANS and 50 μg/ml protein. *, WT apoA-I; Δ, apoA-I[K107A]; ○, apoA-I[K107del]; |, in buffer alone.