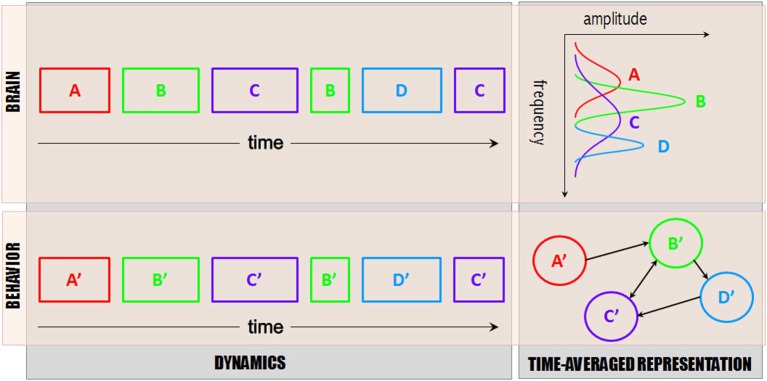
Figure 4.

Brain~behavior scheme. Dynamical descriptions of brain functional networks (top left) and inferred functional processes (bottom left), along with their time-averaged representation (functional graph on lower right and power spectrum on the upper right (note rotated axes to reflect the fact that amplitude is largely inherited from the cumulative duration of the patterns, along with their frequency consistency over time). For simplicity, only one frequency band is represented (say, 10 Hz), and only one process at a time (i.e., no network interaction). In reality, multiple frequency bands (and associated functional processes) occur at the same time. Typically, networks are co-activated and exhibit transient interactions, e.g., via phase locking and metastability. The goal of functional inference is to identify the functional processes (bottom rectangles) that match spatiotemporal patterns of brain activity (top rectangles) and their temporal footprints, so that correspondences between brain and behavior can be uncovered. Though simplistic, a translational language along these lines would propel our understanding of social brain functions and lead the way toward explanatory models.
