
Figure 5.
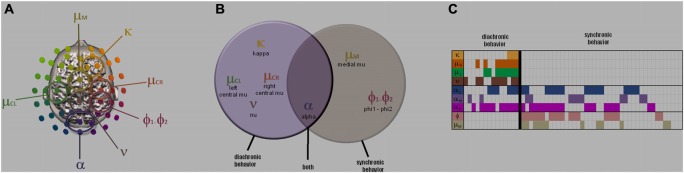
The neuromarker repertoire. Overview of neuromarkers contributing to social behavior obtained from meta-analysis of three studies (supplementary materials S1-S3). (A) shows their scalp topography, (B) a Venn diagram of their recruitment in studies of synchronic and diachronic social behavior, and (C) a meta-analytic table of their interindividual occurrence. Neuromarker location in (A) indicates sensor carrying highest power on the scalp, keeping in mind that this does not imply regional homology with underlying cortical structures. Each column of (C) specifies one of fifty four subjects enrolled in our experiments of social behavior, each row corresponding to a neuromarker. When a neuromarker was detected in a subject, its cell is marked with a color, else it is left blank. Note empty sectors in the lower left and upper right sectors that suggest specific neuromarker landscape for the two types of social behaviors.