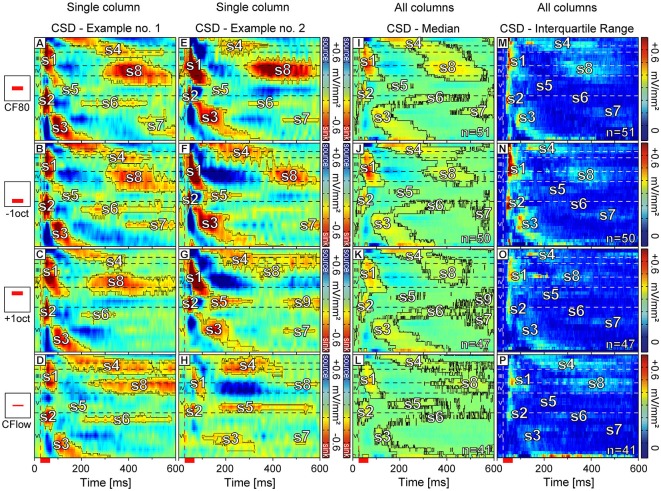
Figure 4.
Color maps of representative and averaged laminar CSD profiles. In the first and second column (A–H) representative CSD profiles of the same cortical column are shown. Neurons were stimulated with four different stimuli: sinus at CF at 80 dB SPL (A,E), sinus at CF one octave below (B,F), sinus at CF one octave above (C,G), and sinus at CF with a level set ≤24 dB above the individual MT (D,H). Sink contours were calculated at 8% of the maximum sink strength of the respective CSD pattern elicited by CF80 stimulation. (I–L) The median of laminar profiles averaged over all recording sites for each stimulus respectively. Sink contours were calculated at 4% of the maximum sink strength of the respective CSD pattern elicited by CF80 stimulation. (M–P) The interquartile range of sinks for each stimulus group specifically. Horizontal dashed lines indicate layer borders while the vertical dashed line marks the beginning of pure tone stimulation. Red scale bar represents stimulus duration of 30 ms.

