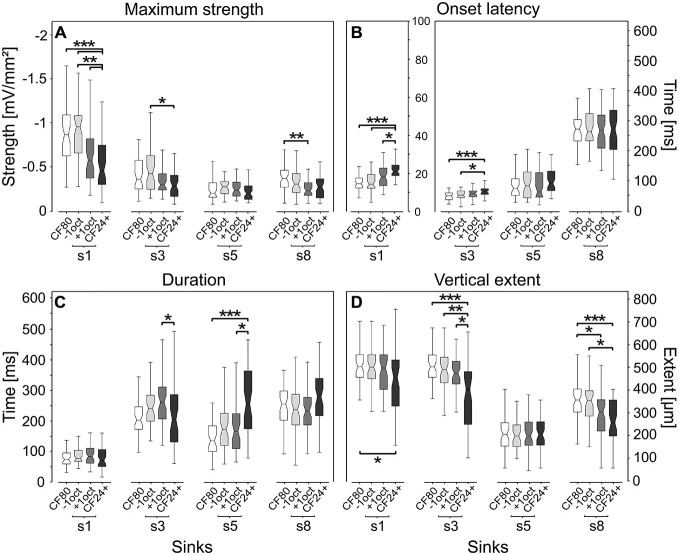
Figure 6.
Quantitative comparison of sink parameters. Parameters were calculated at 8% of the maximum sink strength of the respective CSD pattern elicited by CF80 stimulation. Low level pure tones (CF24+) and pure tone frequencies of one octave distant from CF (−1oct and +1oct) evoke significantly different sinks. Primary sink s1 (see sinks schematic above) and the most strongly elicited secondary sinks from infragranular layer VI (s3) and V (s5) and granular layer IV (s8) are compared. Four parameters were quantitatively assessed: (A) maximum sink strength, related to the strength of neuronal activity. (B) Sink onset latency, note the different y-axes for s1 vs. other sinks. (C) Sink duration. (D) Sink vertical extent. Boxplot whiskers represent data range, outer edge of box represents second and fourth quartiles of data, and midline represents median of data. Significance was determined using Kruskal-Wallis one-way ANOVA in combination with a multiple comparison post hoc test: *p < 0.05, **p < 0.01, ***p < 0.001.

