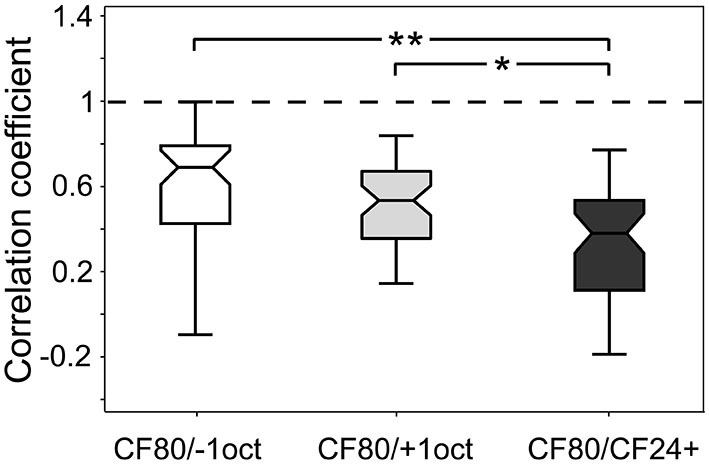
Figure 7.

Stimulus-specific correlation of laminar CSD profiles. Boxplots show the correlation coefficient between the laminar profiles of CF80 compared to the remaining stimuli (−1oct, +1oct, and CF24+). Boxplot whiskers represent data range, outer edge of box represents second and fourth quartiles of data, and midline represents median of data. Significance was determined using Kruskal-Wallis one-way ANOVA in combination with a multiple comparison post hoc test: *p < 0.05, **p < 0.01.
