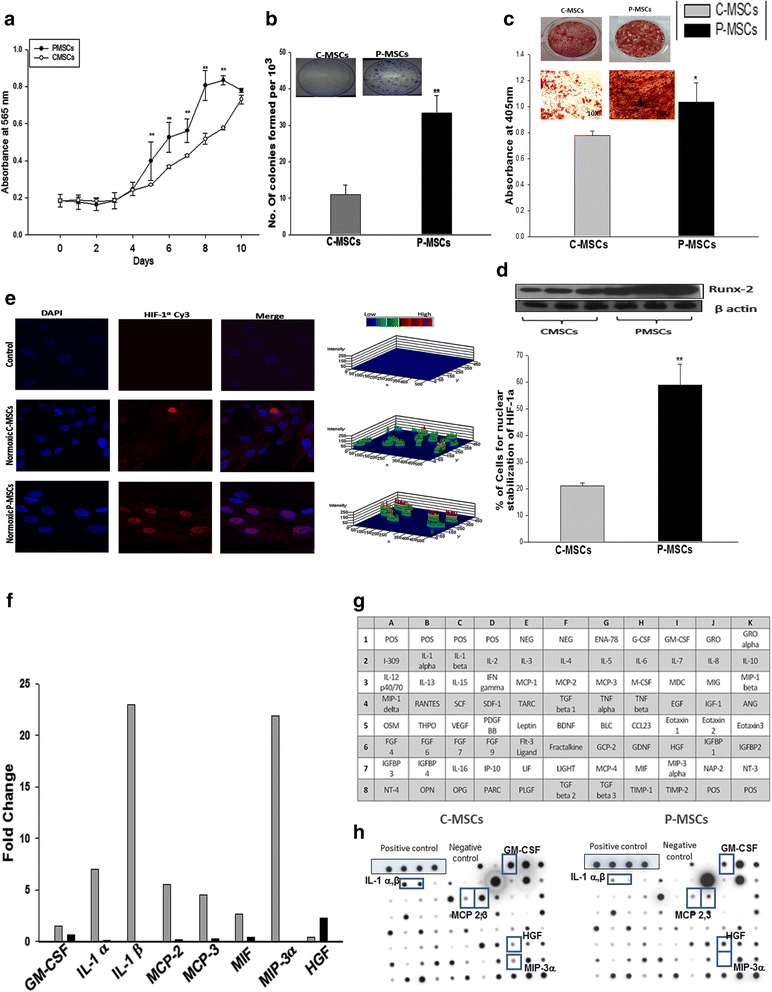
Fig. 6.

C-MSCs and P-MSCs differ in the functional attributes relevant to expansion of HSCs. a P-MSCs had higher rate of proliferation than C-MSCs as determined by MTT assay. b P-MSCs exhibited higher clonogenecity than C-MSCs even at lowest cell concentration. Inset depicts the representative CFU-F colonies stained with crystal violet. c P-MSCs exhibits superior differentiation to osteoblasts depicted by the calcium deposits stained with alizarin red S (Left panel). Right panel shows quantitative analysis after extraction of the dye and its quantitation at 405 nm. d Superior osteoblastic differentiation may be due to the pre-osteoblastic nature of P-MSCs by virtue of higher RUNX-2 expression. e Higher normoxic stabilization of HIF-1α in the nucleus of the P-MSCs than C-MSCs. Left panel shows 3D representations of expression of the HIF-1α as 3-D histograms. Percentage of the positive nuclei from ten random fields/slide of three independent experiments is represented in the graph. f Fold change in the cytokines expression by C-MSCs and P-MSC, respectively. Data represented as mean value of two independent paired samples. g C-MSCs had a distinctive secretion profile mainly of pro-inflammatory cytokines as checked by membrane-based cytokine array. h Represents the hybridization results for a representative sample. Data are represented as mean ± standard deviation from three different independent experimental sets. *p ≤ 0.05, **p ≤ 0.01, and ***p ≤ 0.001. P-MSCs placenta-derived mesenchymal stem cells, C-MSCs cord-derived mesenchymal stem cells, HSCs hematopoietic stem cells, CFU-F colony forming unit-fibroblasts
