
Fig. 2.
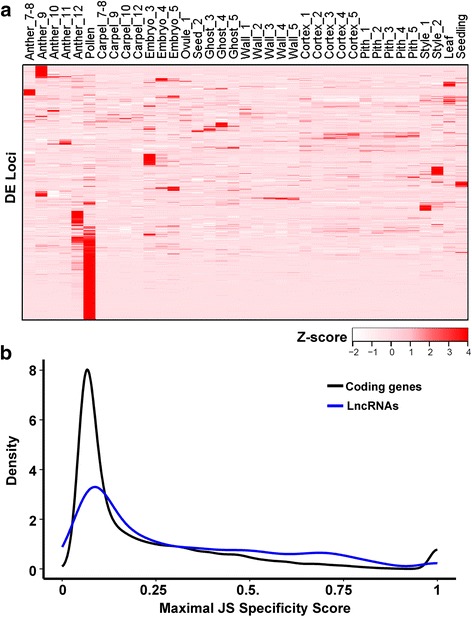
Heatmaps showing tissue-specific expression of differentially expressed lncRNAs. a Heatmap showing expression patterns of 1,619 differentially expressed lncRNAs. They are defined as differentially expressed when q-value < 0.01, fold change > 2 in one of the pairwise comparisons. Z-score obtained from averaged FPKM of two replicates was used. b The distributions of the maximal JS (Jensen-Shannon) specificity score of coding genes and lncRNA-loci, respectively