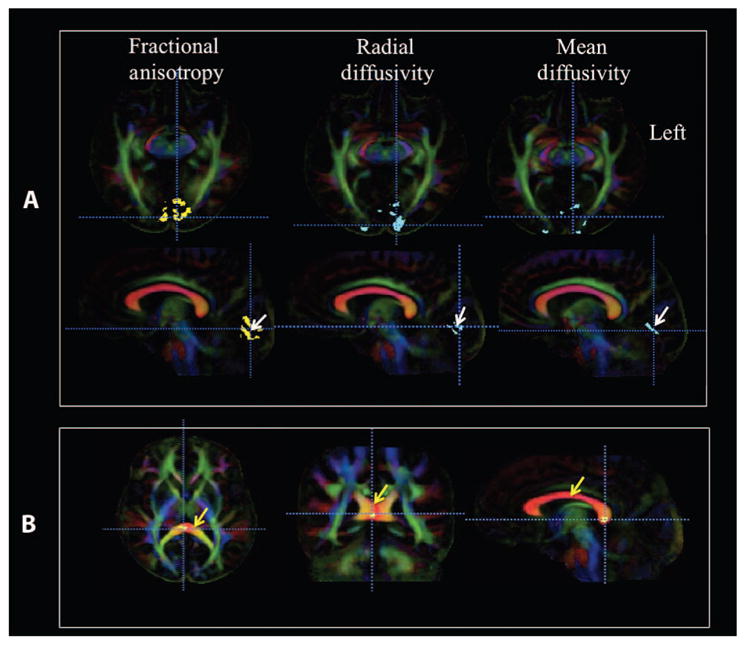
Fig. 1. Voxel-based analyses of diffusion maps comparing LCA2 patients with sighted controls.

(A) Voxel-based analyses of LCA2 patients versus demographically matched normal sighted controls are shown for three diffusion parameters: fractional anisotropy, radial diffusivity, and mean diffusivity. Voxel-based analyses are superimposed onto the color fractional anisotropy population-based atlas constructed from all study participants (n = 21). Images of color fractional anisotropy are presented in the radiological convention (left brain is depicted on the right). In the first column, the voxel-based analyses for fractional anisotropy (revealed as yellow areas; white arrow on sagittal image, second row) showed decreased fractional anisotropy for greater than 100 contiguous voxels, which is significant after correction for multiple comparisons [false discovery rate (FDR), q < 0.05]. Axial images (top row, first column) show larger clusters with reduced fractional anisotropy in the left V1 (3272 voxels) as compared to the right V1 (2301 voxels). Sagittal images (second row, first column) are presented to demonstrate that the reduced fractional anisotropy clusters within the visual cortex are primarily located in and around the calcarine fissure (white arrow), which is also known as the primary visual area (BA-17 and BA-18). In the second column, results from voxel-based analyses for increased radial diffusivity are shown (at the same statistical threshold for fractional anisotropy) in blue clusters superimposed onto the color fractional anisotropy atlas. Similar to fractional anisotropy, the radial diffusivity clusters are larger in the left occipital cortex and primarily located in V1. In the third column, voxel-based analyses for increased mean diffusivity are also shown in blue clusters at the same statistical threshold for fractional anisotropy and radial diffusivity. The increase in mean diffusivity is not as widespread as the radial diffusivity and fractional anisotropy. This may be because no changes in axial diffusivity were detected. (B) Reduced fractional anisotropy clusters (at the same statistical threshold) in the posterior corpus callosum (corpus callosum is marked with yellow arrows) where the left and right occipital fibers that connect the two visual cortices cross. No changes in other diffusion indices were detected for the corpus callosum cluster.
