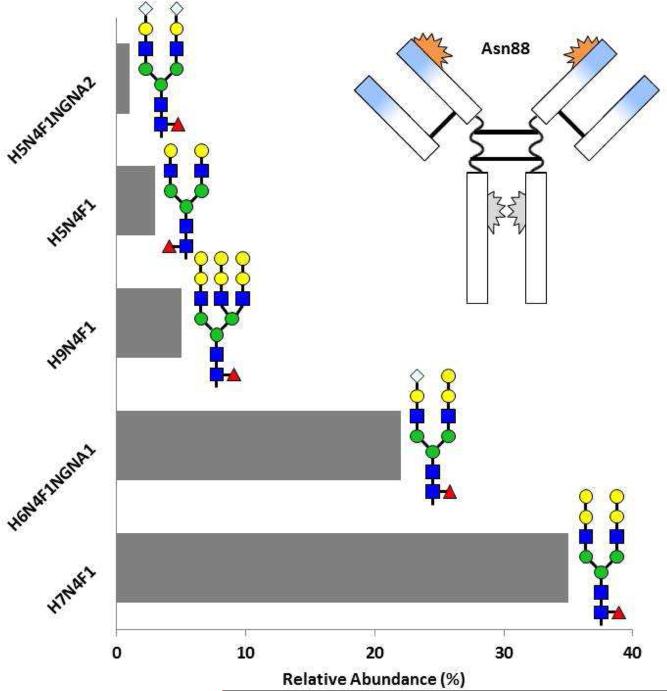
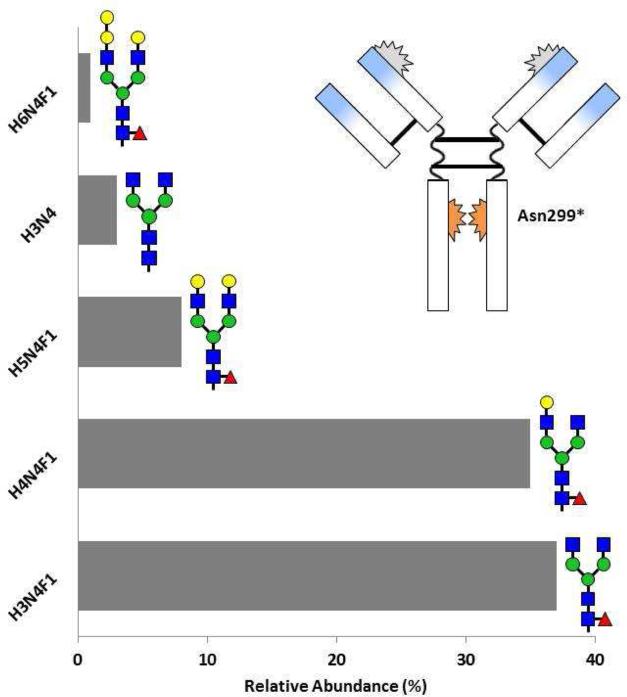
Fig 2.
Relative abundance of glycosylation patterns on cetuximab at sites Asn88 (A) and Asn299 (B) as resolved by mass spectroscopy The blue sections on the Fab arms indicate the murine segments of the antibody. See Figure 1 for glycan structure notation. Adapted from Ayoub D, Jabs W, Resemann A, et al: Correct primary structure assessment and extensive glyco-profiling of cetuximab by a combination of intact, middle-up, middle-down and bottom-up ESI and MALDI mass spectrometry techniques. Landes Bioscience 2013, 5(5):699-710.


