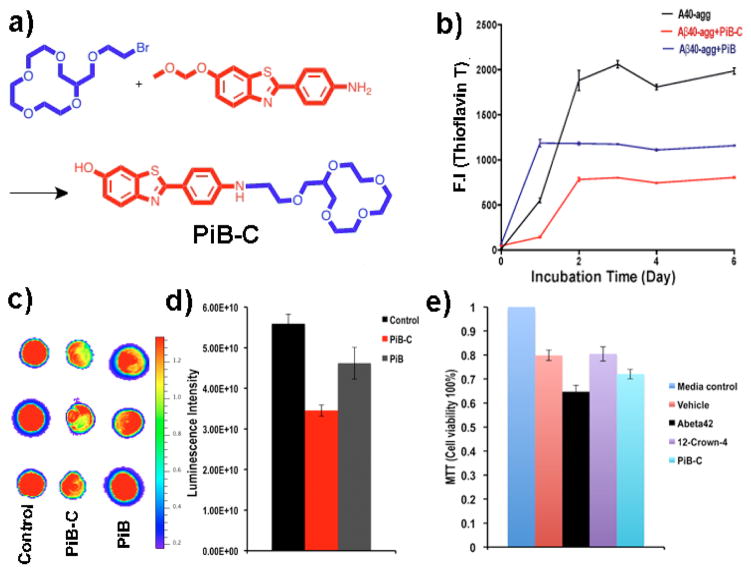
Fig. 2.
Anti-aggregating studies with PiB-C. (a) The synthetic route for PiB-C. (b) Change in fluorescence intensities of ThioT as a measure of Aβ40 aggregation at different time points without (black line) and with PiB-C (red line), and with PiB (blue line) (n=3). (c) Dot blotting of Aβ40 incubated without (left) and with PiB-C (middle), and PiB (right) for 48-hours (n=3). (d) Quantitative analysis of the dots in (c). (e) MTT Testing of cell viability under different treatment conditions.

