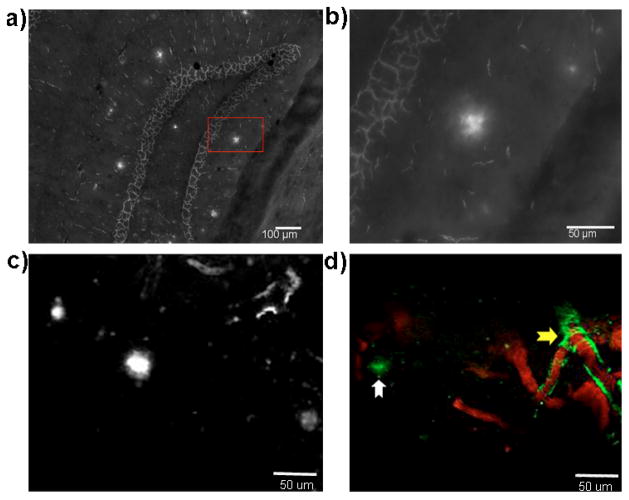
Fig. 3.
Microscopic imaging of amyloid deposits with PiB-C in vitro and in vivo. (a–b) Microscopic images of PiB-C showing stained plaques in a hippocampus area of a brain slice from a 10-month APP-PS1 mouse. (b) Zoomed-in image of a plaque in the red box in (a). (c–d) Representative two-photon images of PiB-C in a 12-month old APP-PS1 mouse. (c) Aβ plaques were highlighted by PiB-C; (d) both CAAs (yellow arrow) and plaques (white arrow) were highlighted by PiB-C (green). The blood vessels were labeled with Texas red-dextran conjugates (MW 70,000) (red).

