
Figure 2.
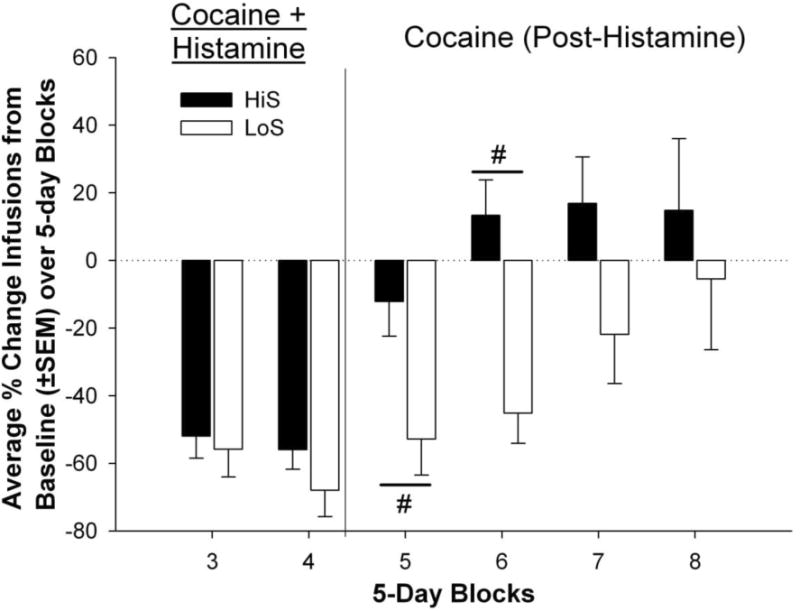
Percent change of infusions self-administered by HiS and LoS rats averaged into 5-day blocks compared to a 5-day baseline average. The # indicates phenotype differences in percent change of infusions self-administered between the phenotypes compared to baseline (p < .05).