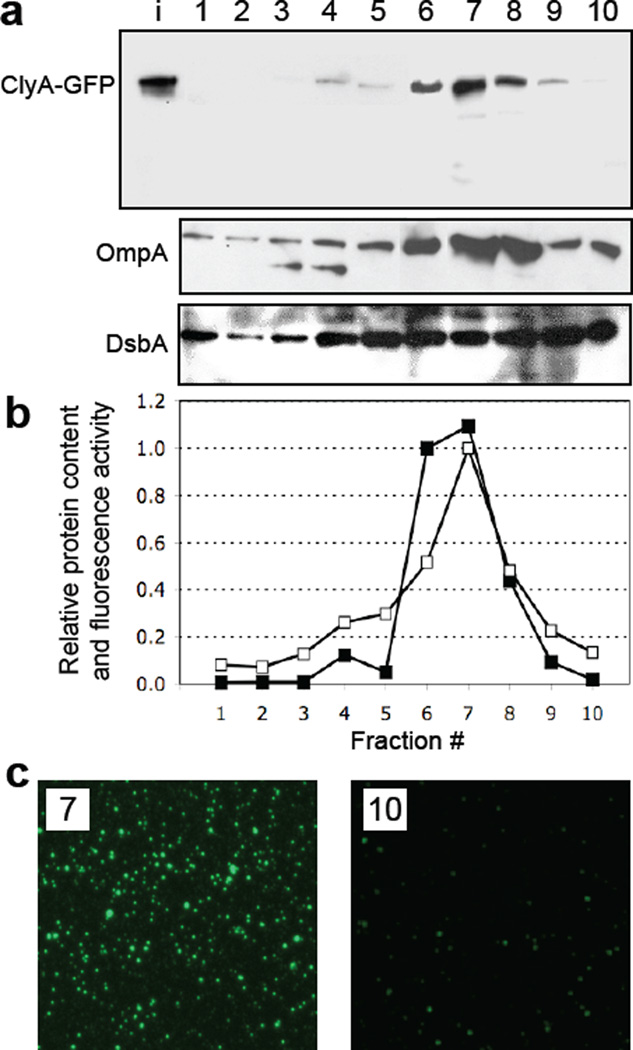
Figure 2.
Density gradient fractionation of vesicles. (a) Electrophoretic analysis of the density gradient fractions from top (lane 1, lowest density) to bottom (lane 10, highest density) from JC8031 cells expressing ClyA-GFP. The bands corresponding to ClyA-GFP (top), OmpA (middle) and DsbA (bottom) were obtained with anti-GFP, anti-OmpA and anti-DsbA serum, respectively. Lane i represents input vesicles from the purified cell-free supernatant. (b) Quantification of the ClyA-GFP levels (filled squared) in each fraction as determined by densitometry using ImageJ software. Band intensity values were normalized to the maximum intensity corresponding to the ClyA-GFP measured in fraction 7. Also plotted is the GFP activity (open squares) measured in each fraction and normalized to the maximum activity, which also corresponded to fraction 7. (c) Fluorescence microscopy of vesicles that migrated in gradient fractions 7 and 10.

