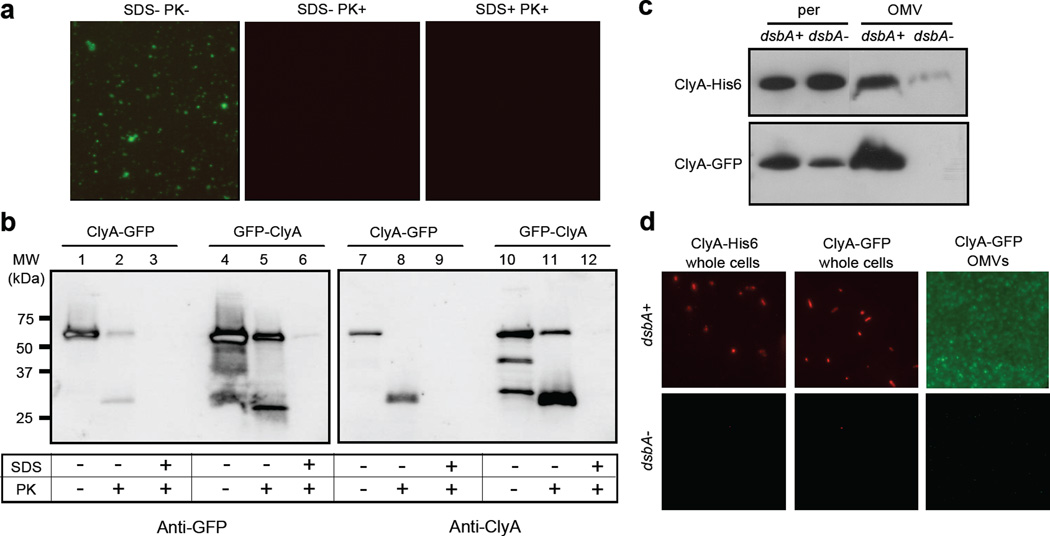
Figure 5.
Biochemical and genetic analysis of ClyA localization. Proteinase K susceptibility of OMV-tethered GFP as determined by: (a) fluorescence microscopy of vesicles generated from JC8031 cells expressing ClyA-GFP treated with Proteinase K and SDS as indicated; and (b) Western blot of vesicles generated from JC8031 cells expressing ClyA-GFP or GFP-ClyA. Blots were probed with mouse anti-GFP (left panels) or anti-ClyA serum (right panels). Molecular weight (MW) ladder is marked at left. An equivalent number of vesicles was used in all cases. (c) Western blot analysis of periplasmic and OMV fractions from JC8031 (dsbA+) and JC8031 dsbA::Kan cells (dsbA-) expressing either ClyA-GFP or ClyA-His6 as indicated. (d) Immunofluorescence (left and center panels) of wt JC8031 (dsbA+, top) and JC8031 dsbA::Kan cells (dsbA-, bottom) expressing pClyA-GFP or pClyA-His6 as indicated and fluorescence (right panel) of vesicles derived from the same cells as indicated. For immunofluorescence, cells were treated with either mouse monoclonal anti-GFP or anti-polyhistidine antibodies and subsequently with rhodamine-conjugated anti-mouse IgG.

