Fig. 1.

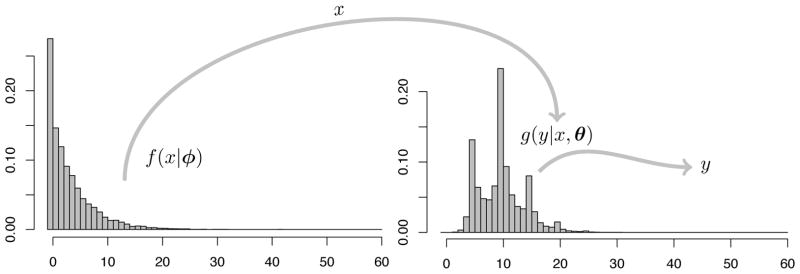
Mixture model schematic for reported counts. Each subject chooses their true count x from the distribution f(x|ϕ), then reports the possibly different count y drawn from the distribution g(y|x, θ).

Mixture model schematic for reported counts. Each subject chooses their true count x from the distribution f(x|ϕ), then reports the possibly different count y drawn from the distribution g(y|x, θ).