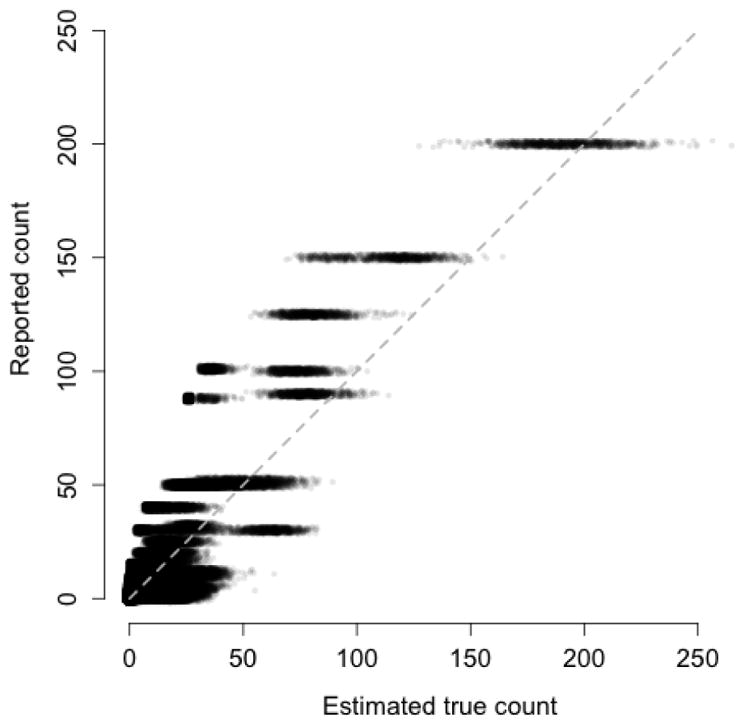
Fig 7.

Posterior samples of true counts on the horizontal axis versus reported counts on the vertical axis for the CLEAR data under the BDP heaping model. The points have been slightly jittered to show the density of posterior samples. A gray dashed line is shown on the diagonal.
