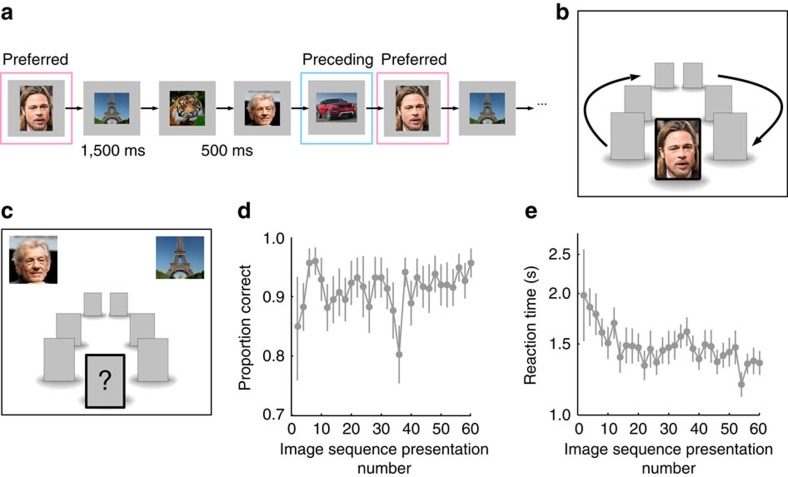
Figure 1. Learning task and behaviour.
(a) During the AL sessions we presented a sequence of 5–7 images in a fixed order. The sequence contained one preferred image for a selective neuron identified in prior screening sessions. The image preceding the preferred image was always non-preferred for the recorded neuron. Each image was presented for 1.5 s followed by an ISI of 500 ms. The sequence was repeated 60 times. (b) Each image was presented at the centre of the screen while three placeholders (empty grey squares) were presented on either side. At the end of the image presentation period a placeholder replaced the central image and the placeholders moved in the clockwise direction for the duration of the ISI. At the end of the ISI the central placeholder was replaced by the next image in the sequence. (c) Twenty per cent of trials were test trials on which patients (N=8) saw two choice images and had to report which of the two would be the next image in the sequence. (d) Average accuracy and (e) average reaction times, shown on a log scale (to increase visibility), on test trials averaged across all subjects and sessions, as a function of image sequence presentation number (binned by groups of two sequence presentations). Error bars represent s.e.m. Accuracies reached their maximum by ∼8 sequence presentations. Reaction times decreased more progressively with sequence presentation number. Eiffel Tower, Benh Lieu Song, CC BY-SA 2.0. Ian McKellen, Gage Skidmore, CC BY-SA 3.0.

