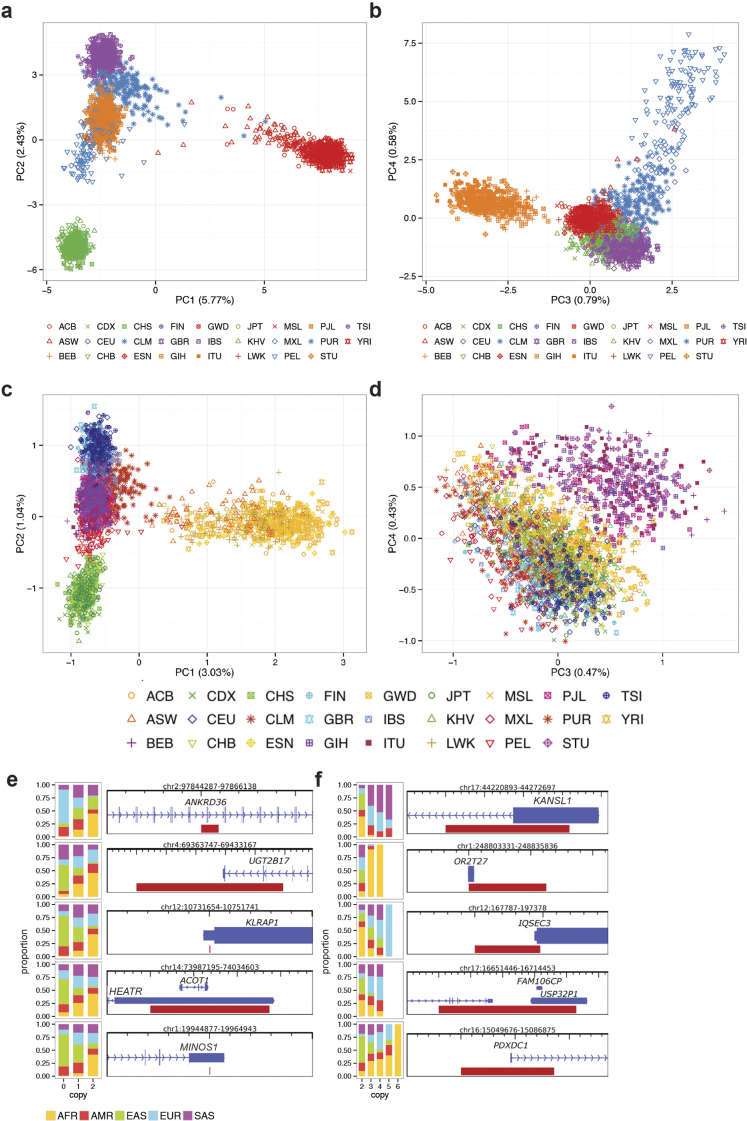
Extended Data Figure 6. Principal component analysis and population stratification of SVs.
a, Principal component analysis (PCA) plot of principal components 1 and 2 for deletions. b, PCA plot of principal components 3 and 4 for deletions. c, PCA plot of principal components 1 and 2 for MEIs. d, PCA plot of principal components 3 and 4 for MEIs. e, The five most highly population-stratified deletions intersecting protein-coding genes based on VST. f, The five most highly population-stratified duplications and multi-allelic copy number variants (mCNVs) intersecting protein-coding genes based on VST. For abbreviations, see Supplementary Table 1.

