Figure 1.

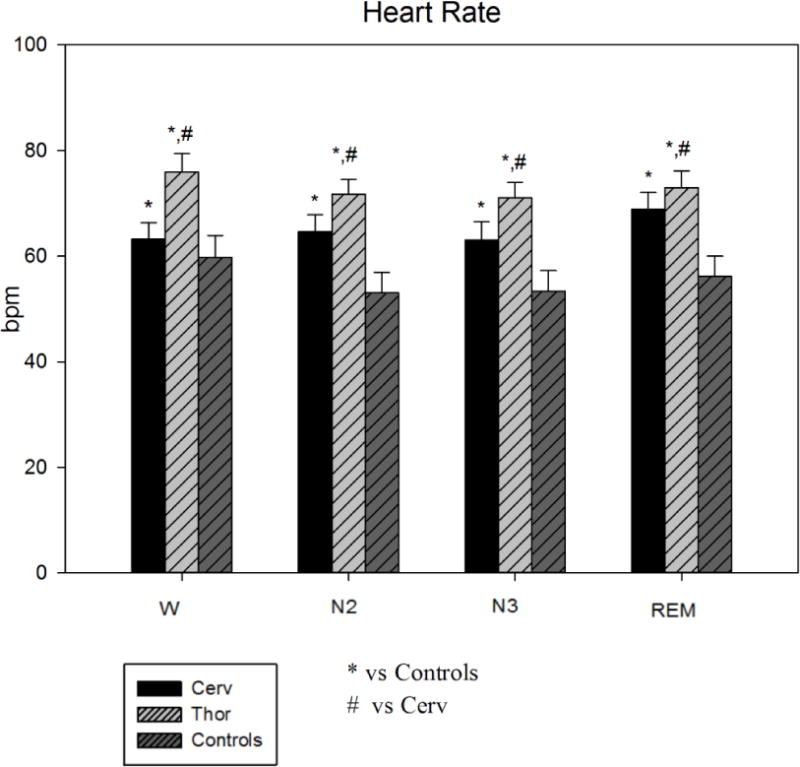
Heart Rate during sleep stages in the three groups (Cerv, Thor, Controls). HR is significantly higher in Cerv and Thor compared to Controls during W and sleep. * = p<0.05 vs Controls; # = p<0.05 vs Cerv.

Heart Rate during sleep stages in the three groups (Cerv, Thor, Controls). HR is significantly higher in Cerv and Thor compared to Controls during W and sleep. * = p<0.05 vs Controls; # = p<0.05 vs Cerv.