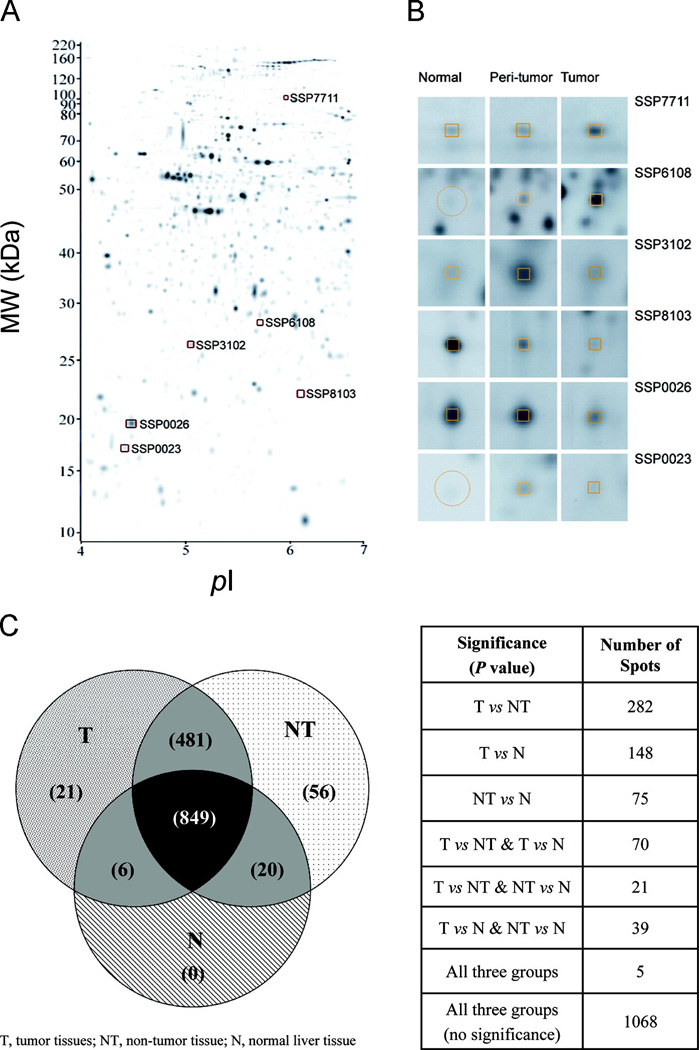
Fig. 1. Differential expression profiles of HCC proteome.
(A) Liver tissue lysates were separated by IEF in the range of pI 4–7, followed by second dimension (MW, 10–250 kDa) of PAGE and silver staining.
(B) Representative gel pictures of the six reference points from HCC, peritumor and normal liver tissues were shown.
(C) Venn diagram showing the numerical distribution of protein spots presents in tumor (T), non-tumor (NT) and normal (N) livers. The numbers of protein spots with significant changes (P<0.05) among the three different comparison groups (T vs NT, T vs N, and NT vs N) were tabulated. Statistical analysis was performed by one-way ANOVA and student-T-test (p < 0.05).

