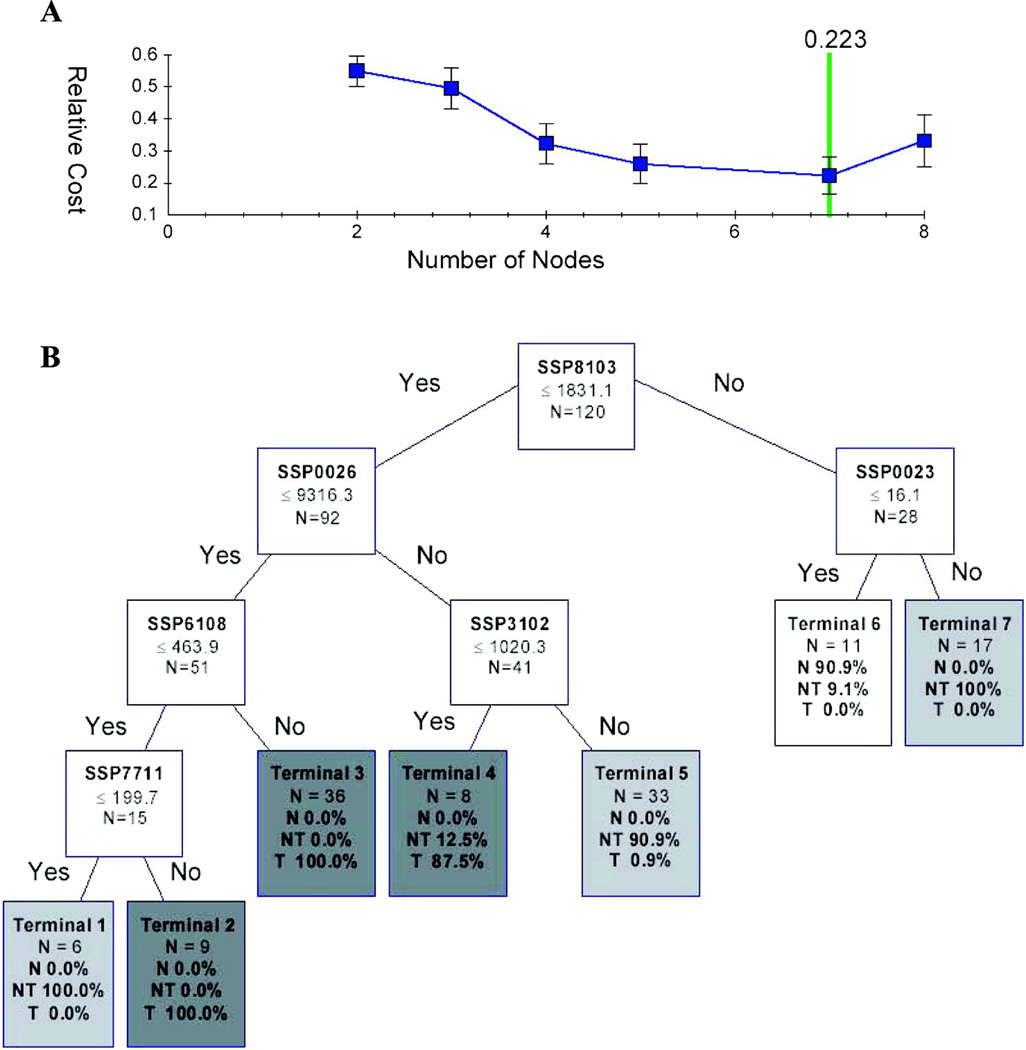
Fig. 2. The optimal classification tree generated by CART.
(A) The cost value of decision trees with varying number of terminal nodes.
(B) The optimal decision tree is composed of 6 discriminative classifiers. The decision making process involves the evaluation of if-then rules of each node from top to bottom, which eventually reaches a terminal node with designated class outcome: tumor (T), non-tumor (NT) or normal (N).

