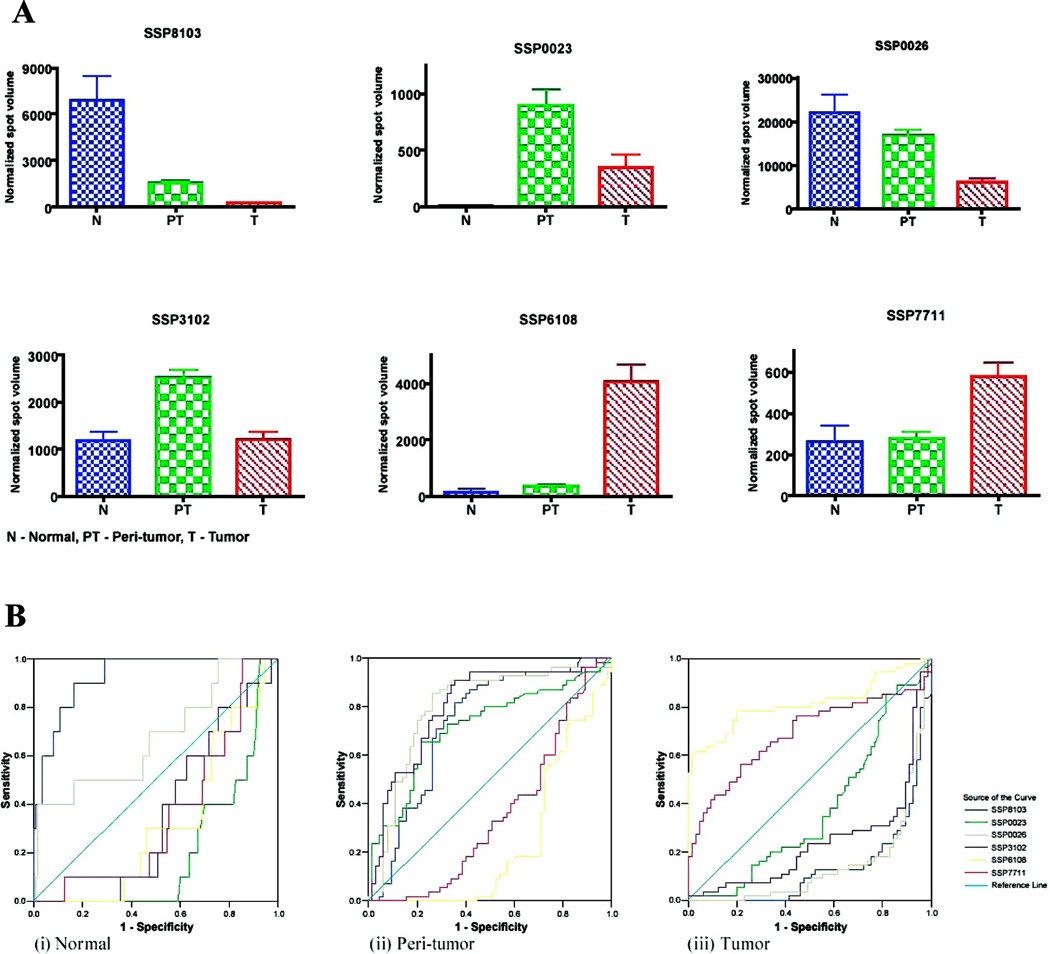
Fig. 3. Spot intensities and ROC curves of each six protein markers differentially expressed in HCC, non-tumor and normal liver tissues.
(A) Spot intensities on 2-DE gel of the six protein markers were graphically presented in respective histogram charts. Each bar represents a mean ± SD of the normalized spot intensity in ppm. Data were from the training set and the sample sizes were 55 (T), 55 (NT) and 10 (N). Statistical analysis was performed by student-T-test (p < 0.05) when compared T vs NT and T vs N.
(B) ROC curves of the 6 protein markers for their discriminative powers in the categories of normal livers (N), peri-tumor tissues (PT), and tumor tissues (T). For example, SSP8103 and SSP0026 showed preferential values for normal liver; SSP3102, SSP0023, SSP0026, SSP8103 for non-tumor, and SSP6108, SSP7711 for tumor, respectively. Data were from the training set.

