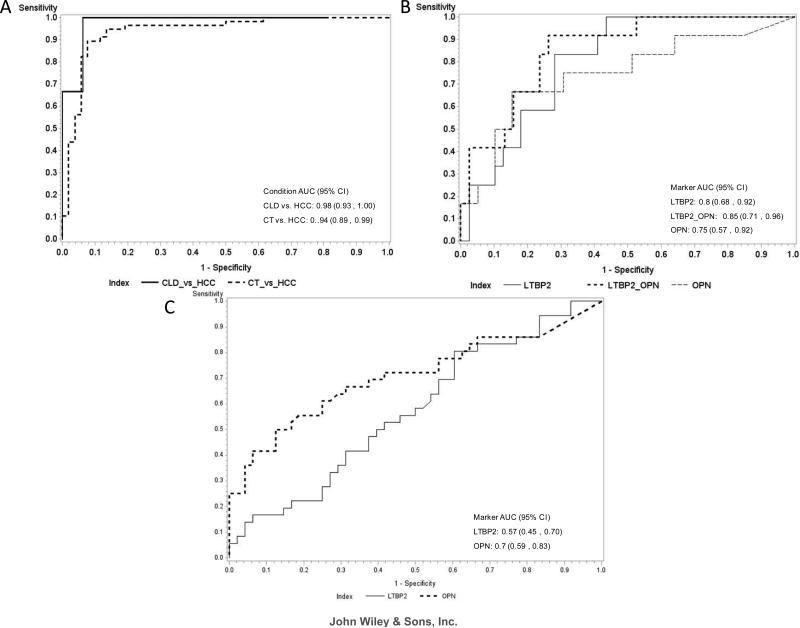
Figure 3. Receiver operating curves (ROC).
(A) LTBP2 in controls vs. HCC patients (CT vs. HCC) and chronic liver disease vs. HCC patients (CLD vs. HCC) at an AFP cut-off ≤ 20 ng/mL in case-control 1; (B) LTBP2, OPN and LTBP2 combined to OPN in chronic liver disease vs. HCC patients at an AFP cut-off ≤ 20 ng/mL in case-control 2; (C) LTBP2 and OPN in chronic liver disease vs. HCC patients at an AFP cut-off ≤ 20 ng/mL in case-control 3. The area under the ROC curve (AUROC) is shown with its 95% confidence intervals.

