
Fig. 2.
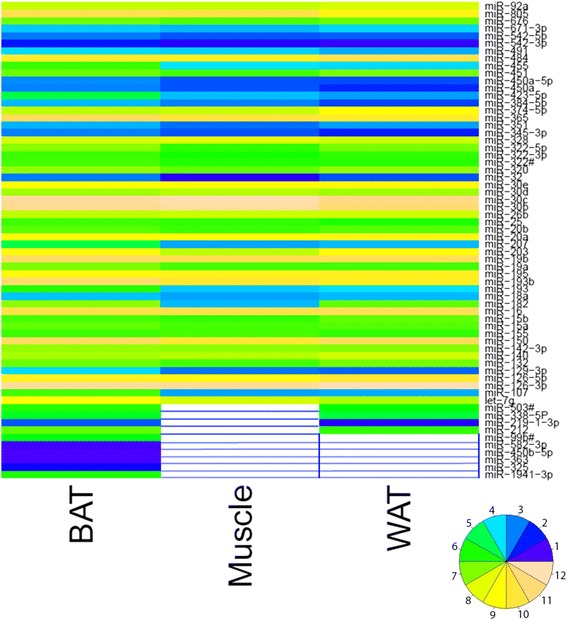
Heat map of the 64 miRNAs specifically and highly expressed in mouse BAT as compared with muscle and WAT. Values 1 and 12 represent the lowest and highest values, respectively. White values represent non-expressed miRNAs
Official websites use .gov
A
.gov website belongs to an official
government organization in the United States.
Secure .gov websites use HTTPS
A lock (
) or https:// means you've safely
connected to the .gov website. Share sensitive
information only on official, secure websites.
Heat map of the 64 miRNAs specifically and highly expressed in mouse BAT as compared with muscle and WAT. Values 1 and 12 represent the lowest and highest values, respectively. White values represent non-expressed miRNAs