Fig. 1.

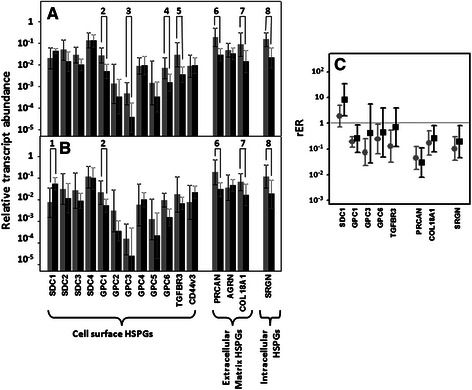
Differential transcription of genes encoding HSPGs. a, b Relative transcript abundance of mRNAs for HSPGs, grouped according to their topographic location: on the cell surface, in the extracellular matrix or intracellular. Relative abundance for healthy tissues (gray bars) and tumors (black bars) are plotted on a log scale for each gene assayed and the spreads represent the standard deviations. Genes that display significant differences in their transcription levels are highlighted. a Non-metastatic CRCs. 2: glypican-1 (p < 0.01); 3: glypican-3 (p = 0.018); 4: glypican-6 (p = 0.02); 5: betaglycan (p < 0.01); 6: perlecan (p = 0.01); 7: collagen XVIII (p < 0.01); 8: serglycin (p = 0.01). b Metastatic CRCs. 1: syndecan-1 (p = 0.02); 2: glypican-1 (p = 0.03); 6: perlecan (p = 0.015); 7: collagen XVIII (p = 0.04); 8: serglycin (p = 0.017). c Relative expression ratio of genes that show statistically significant differences in expression in non-metastatic (●) or metastatic (■) CRCs. Values on the Y axis are represented on a logarithmic scale
