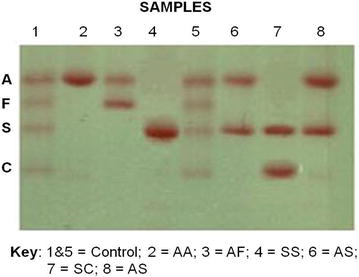
Fig. 2.

A figure of cellulose acetate Hb electrophoresis from a person without and others with sickle cell trait and disease. The figure represents 6 sickling positive samples (2, 3, 4, 6, 7 and 8) and control samples (1 and 5). The control samples were for genotypes AFSC whilst sample 2 was for genotype AA, 3 for AF, 4 for SS, 6 for AS, 7 for SC and 8 for AS
