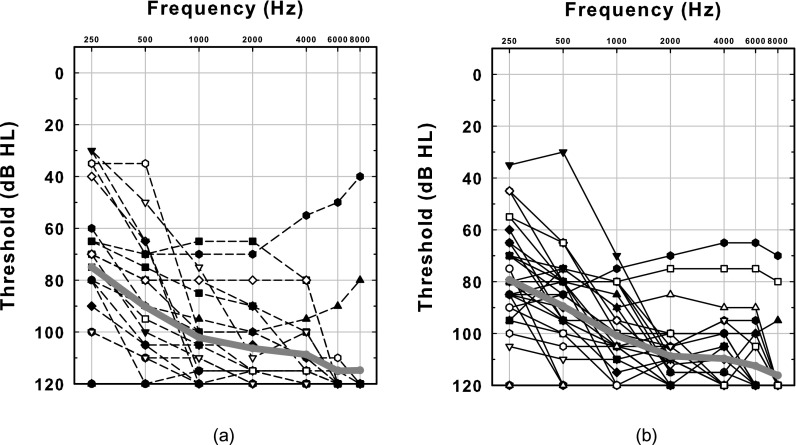
FIG. 5.
Audiograms obtained preoperatively for all CI subjects in the two studies. (a) The audiograms of the subjects who participated in the Henry et al. (2005) study. (b) The audiograms of the current study. The thick grey line shows the mean threshold for each frequency for all subjects in each group.

