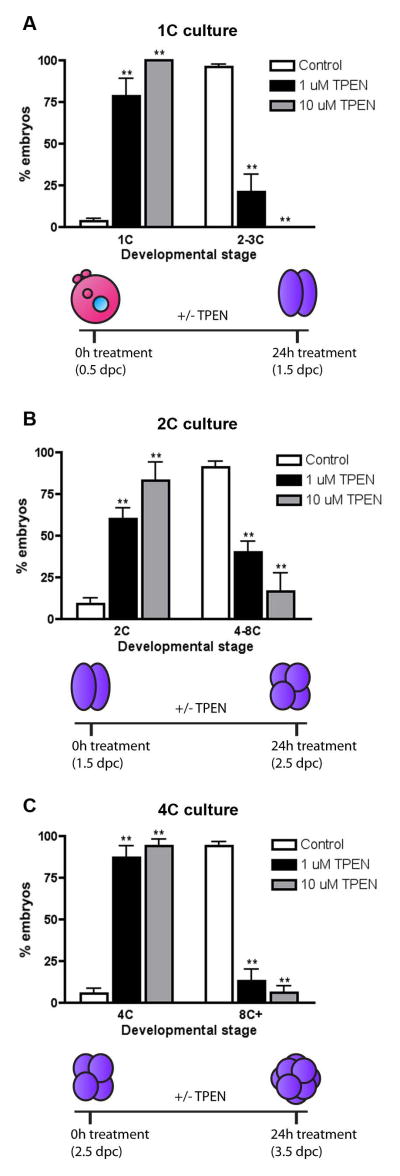
Figure 3. TPEN exposure results in developmental arrest of cleavage stage preimplantation embryos.
1C (A), 2C (B), and 4C (C) embryos were cultured in the presence of 0 μM (white bar), 1 μM (black bar), or 10 μM TPEN (grey bar) for 24 h and developmental progression was scored by morphology. The percentage of embryos at each stage of development per treatment condition was calculated. Experiments were performed in triplicate with a minimum of 20 embryos per group. Results are reported as the mean ± SEM. Asterisks represent statistical significance as compared to control embryos at that particular developmental stage (**p<0.001). The schematics below each graph depict the experimental timing and expected developmental stage for control embryos. 1C = one-cell, 2C = two-cell, 4C = four-cell, 8C+ = eight-cell, morula and early blastocyst, dpc = days post coitus.

