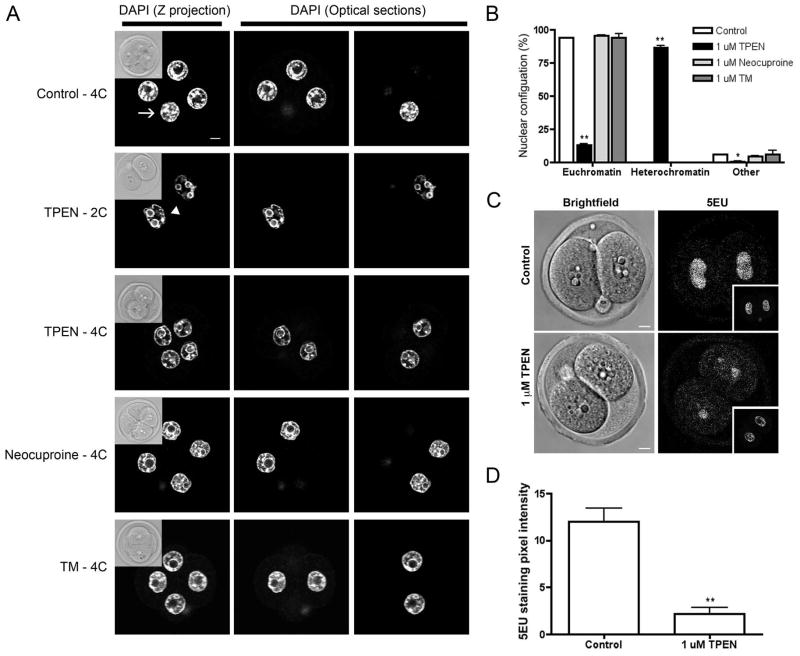
Figure 6. TPEN exposure results in chromatin and global transcription alterations in the preimplantation embryo.
(A) 2C embryos were cultured for 24 h in control media or media containing 1 μM TPEN, 1 μM neocuproine, or 1 μM tetrathiomolybdate (TM) for 24 h and then fixed and immunostained to visualize chromatin morphology with DAPI. For each treatment group, the Z-projection image is shown alongside optical sections where the nuclei were visible in each individual blastomere of an embryo. Insets represent brightfield images. Arrows highlight blastomeres containing DNA in a euchromatin configuration, arrowheads highlight blastomeres containing DNA with a prominent heterochromatin. (B) The percentage of embryos with euchromatin and heterchromatin were quantified. Experiments were performed in duplicate with 7–20 embryos per group. Data represent the mean ± SEM. Asterisks represent statistical significance as compared to control embryos (*p<0.05, **p<0.001). (C) Embryos were cultured in the presence or absence of 1 μM TPEN for 24 h and processed for 5-ethynyl uridine (5EU) incorporation. Representative brightfield images and images of 5EU incorporation are shown for embryos in each treatment group. Insets show the nuclear area as defined by DAPI staining. (D) Quantification of global transcriptional activity according to the mean intensity of 5EU incorporation within the nuclear area. Experiments were performed in duplicate with 12–15 embryos per group. Results represent the mean ± SEM. Asterisks represent statistical significance as compared to control embryos in that developmental stage (**p<0.001). Scale bar = 10 μM.

