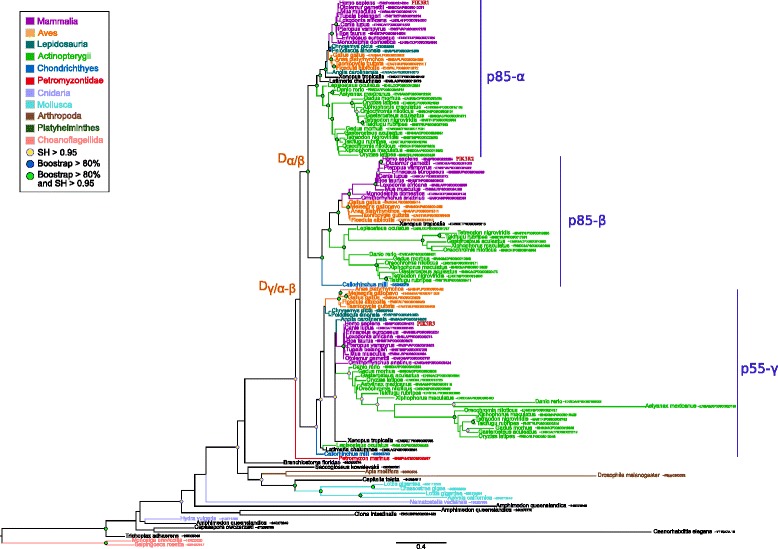
Fig. 3.

Maximum likelihood phylogenetic tree of class IA regulatory PI3Ks subunits. The tree was inferred with the JTT+ Γ 4 model (539 sites, 126 sequences). Branch statistical supports and duplication events are shown using the same symbols as in Fig. 1. The scale bar represents the average number of substitutions per site
