Fig. 4.2.
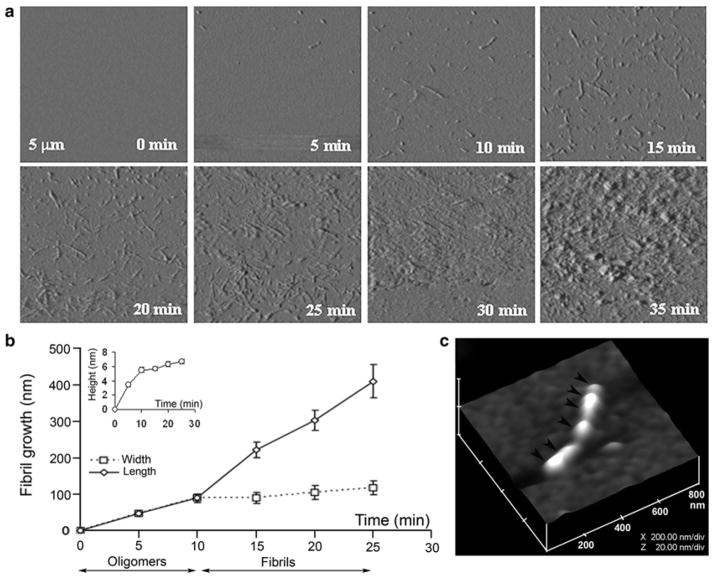
Dynamics of amylin aggregation on solid surface. (a) Structural intermediates, oligomers and fibrils, are resolved during amylin aggregation on mica by time-lapse AFM (tapping mode amplitude images). Note a time-dependent transition of human amylin from small round oligomers (0–10 min) into fibrils during early-mid stage of amylin aggregation (10–25 min). Late–stage of amylin aggregation (25–35 min) is characterized by accumulation of massive peptide deposits on the mica surface. All micrographs are 5 × 5 μm. (b) Fibril growth curves reveal two phases of amylin aggregation, an early oligomeric phase (0–10 min) characterized by oligomers formation, followed by oligomers incorporation into growing fibrils (10–25 min, second phase or fibril maturation). Note the significant increase in oligomer heights (inset) and widths during the first phase of amylin aggregation, and an abrupt increase in fibrils length following formation of full-size oligomers. Data represents mean particle size at each time point (mean ± SEM), obtained from three independent time-lapse AFM experiments. (c) 3-D AFM image of a single full-grown fibril on mica showing arrangement of several amylin oligomers and their bi-directional extension into a fibril (depicted by arrowheads). Micrograph is 800 × 800 nm scale

