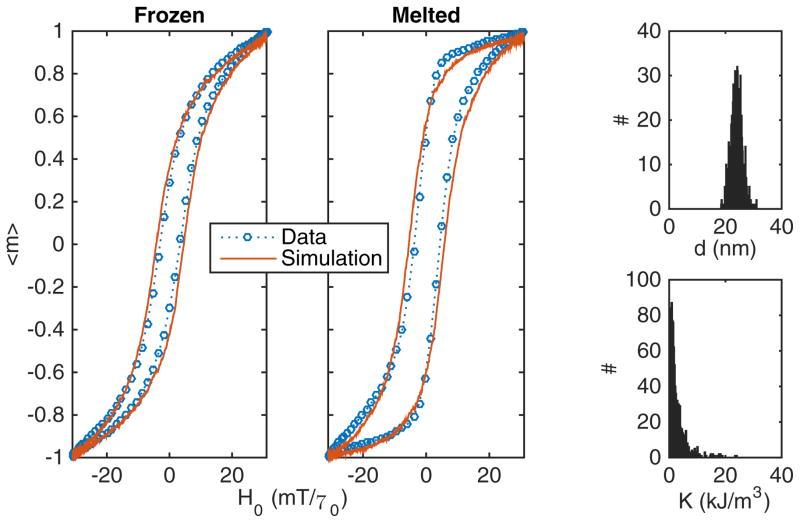
FIG. 11.
(Color online) Comparison between simulation and experiment for nanoparticles either in either a frozen or melted state. Spectroscopy was performed with a 26-kHz, 31 mT/μ0 field. The log-normal distributions of particle diameter and anisotropy constant are shown on the right by number in a representative 1000-particle subsample.

