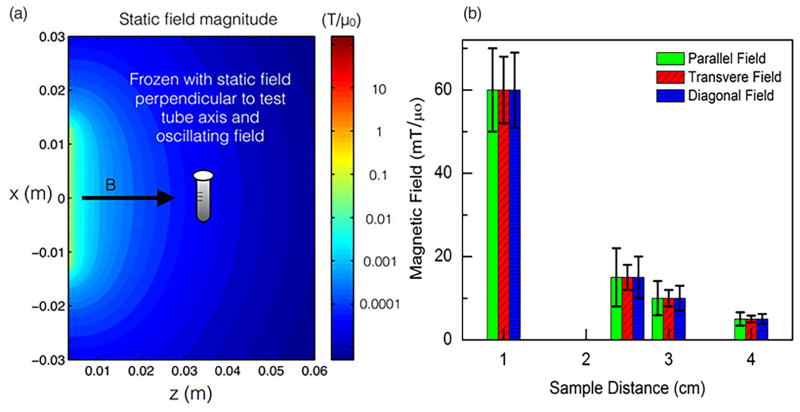
FIG. 3.
(Color online) (a) The simulated magnetic field of the permanent magnet (lines of equal field strength are shown in the figure). The test tube containing the SPIOs was frozen in this orientation at various distances to achieve the varying magnetic field amplitudes. In the example illustrated in (a), the aligning field was applied perpendicular to the direction of the oscillating (drive) field, which was always applied parallel to the long axis of the sample tube. The surface field for these magnets is 0.12 T, so we see that at 5 cm the field is in the single millitesla range as shown in experiment. Notably at this distance we can see the variations in the field are minimal within the test tube. (b) Measured variation of field strength with distance from the magnet. Error bars represent the variation in field within the sample tube for the stated field orientation, and they differ because the tube geometry is anisotropic.

