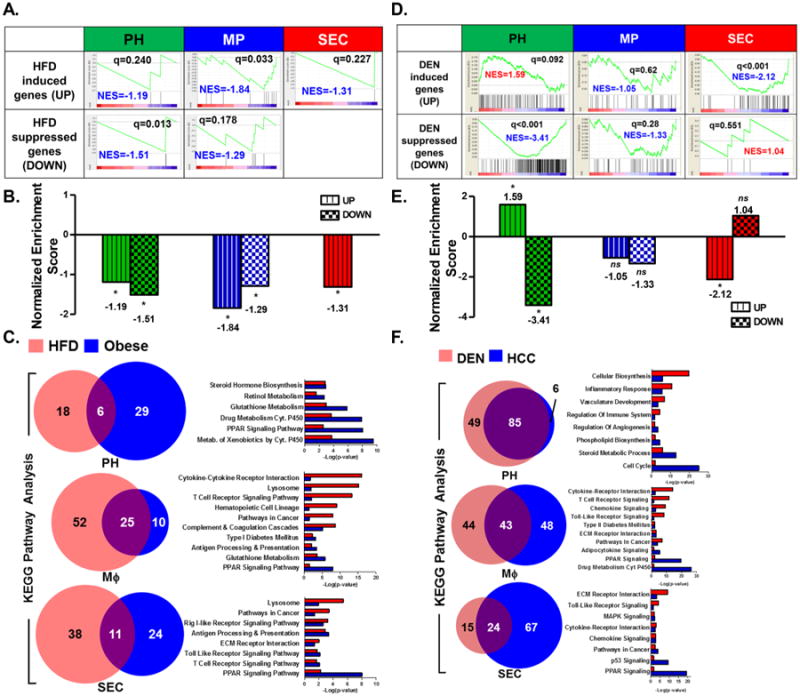
Figure 6. Gene expression signature from DEN-treated PH matched the gene signature from a human HCC gene set.

A. Association of gene expression signatures of HFD-treated liver PH, MP, and SEC with gene signature derived from human obese liver biopsies. In all three cell types, only the HFD-suppressed gene signatures matched the human obese liver signature [20]. B. Normalized enrichment scores (NES) of HFD-induced (UP) and HFD-suppressed (DOWN) genes from liver PH, MΦ, and SEC relative to a human obese liver gene signature [20] via the GSEA method. C. Commonality of altered pathways determined via KEGG Pathway functional analyses observed between HFD-treated PH, MΦ, or SEC and human obese liver gene set [20]. D. Association of gene expression signatures of DEN-treated liver PH, MΦ, and SEC with gene signature derived from human HCC tumors [18,19]. Of all three cell types, only PH demonstrated a gene expression signature (both upregulated and down-regulated) that matched the human HCC signature. E. Normalized enrichment scores (NES) of DEN-induced (UP) and DEN-suppressed (DOWN) genes from liver PH, MΦ, and SEC relative to the human HCC gene signature [18,19] via the GSEA method. F. Commonality of altered pathways determined via KEGG Pathway functional analyses observed between DEN-treated PH, MΦ, or SEC and a human HCC gene set [18,19]. Data show the mean of 2 independent samples of a pool of 3–4 animals.
